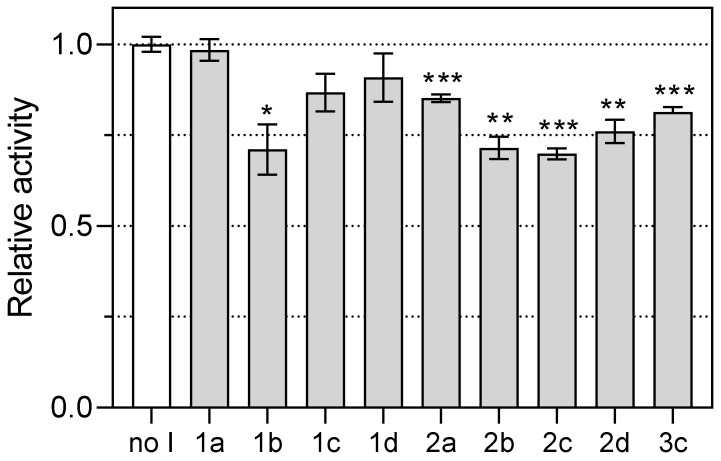
Figure 5.
Effect of compounds 1a–d, 2a–d, and 3c on PfDHODH activity. Asterisks denote statistically significant pairwise differences between the samples and uninhibited control (* p < 0.05, ** p < 0.01, *** p < 0.001) calculated with Welch’s t-test. The plot was drawn with GraphPad Prism 9.4 Software (GraphPad Inc., San Diego, CA, USA), which was also used for statistical comparison of data.

