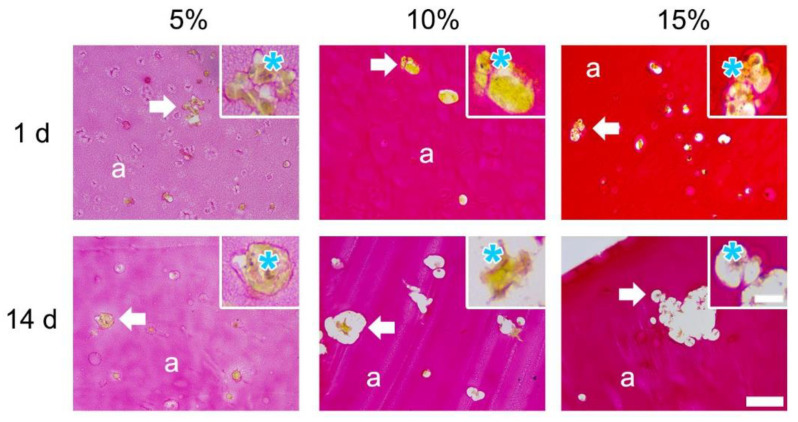
Figure 4.
Picrosirius red stain of cell-loaded 5%, 10%, and 15% GelMA. Overview (Scale bar 100 µm) indicates the hydrogel (a) and the areas of clustered cells (white arrow). Such clustered areas are shown in the magnified view (Scale bar 25 µm); the cytoplasm of the cell and the nuclei are indicated with a cyan asterisk.

