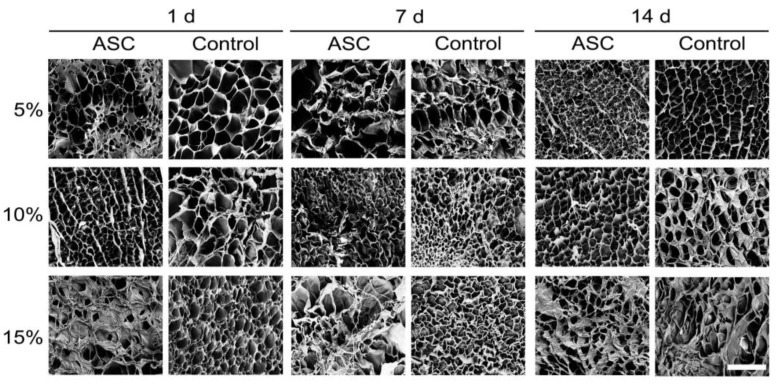
Figure 7.
Surface ultrastructure of cell-loaded (ASC) and cell-free (Control) GelMA hydrogels according to scanning electron microscopy (SEM) at 1 d, 7 d, and 14 d. Representative images derived from three independent samples per timepoint, from a minimum of six random areas per hydrogel. Scale bar represents 40 µm. All micrographs have the same magnification.

