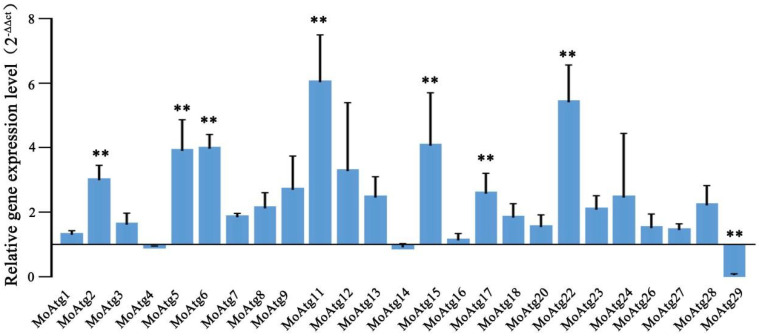
Figure 7.
Analysis of the expression levels of core autophagy genes in M. oryzae. The relative mRNA levels of core autophagy genes (MoATG1/MGG_06393, MoATG2/MGG_16734, MoATG3/MGG_17909, MoATG4/MGG_03580, MoATG5/MGG_09262, MoATG6/MGG_03694, MoATG7/MGG_07297, MoATG8/MGG_01062, MoATG9/MGG_09559, MoATG11/MGG_04486, MoATG12/MGG_00598, MoATG13/MGG_454, MoATG14/MGG_03698, MoATG15/MGG_12828, MoATG16/MGG_05255, MoATG17/MGG_07667, MoATG18/MGG_03139, MoATG20/MGG_12832, MoATG22/MGG_09904, MoATG23/MGG_10579, MoATG24/MGG_03638, MoATG26/MGG_03459, MoATG27/MGG_02386, MoATG28/MGG_08061, MoATG29/MGG_02790) were quantified using qPCR, and the results were normalized to α-ACTIN expression and compared to the WT results in the aerial mycelia of ∆Mokns1 mutant. Error bars represent standard deviation. Significant differences compared with the WT were estimated using Duncan’s test (** p < 0.01).

