Figure 1.
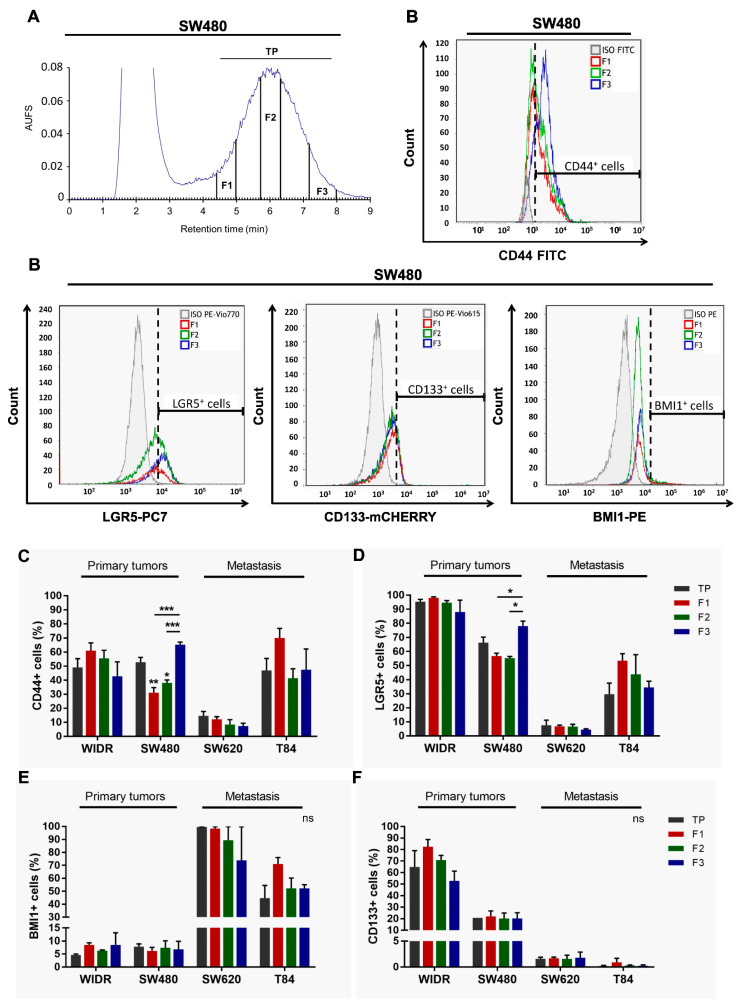
Phenotypic characterization of SdFFF sorted cell subpopulations from CRC cell lines. (A) Fractogram of the SW480 cell line obtained by SdFFF with the sorted cell subpopulations: total peak control (TP), F1, F2, and F3. AUFS: absorbance units full scale. (B) The expression level of CSC markers, CD44, LGR5, BMI1, and CD133, was assessed by flow cytometry and plotted as histograms for the SW480 cell line. Graphs show one representative biological replicate (n = 3). (C–F) Quantification of CD44 (C), LGR5 (D), BMI1 (E), and CD133 (F) positive cells was summarized in the bar plot for all cell lines. All these results are represented as means ± SEM and statistical differences with ns means a non-significant result both between the sorted cell subpopulations and between a sorted subpopulation and the control, * p-value < 0.05, ** p-value < 0.01, *** p-value < 0.001, and * alone for significant results compared to TP using one-way ANOVA test.

