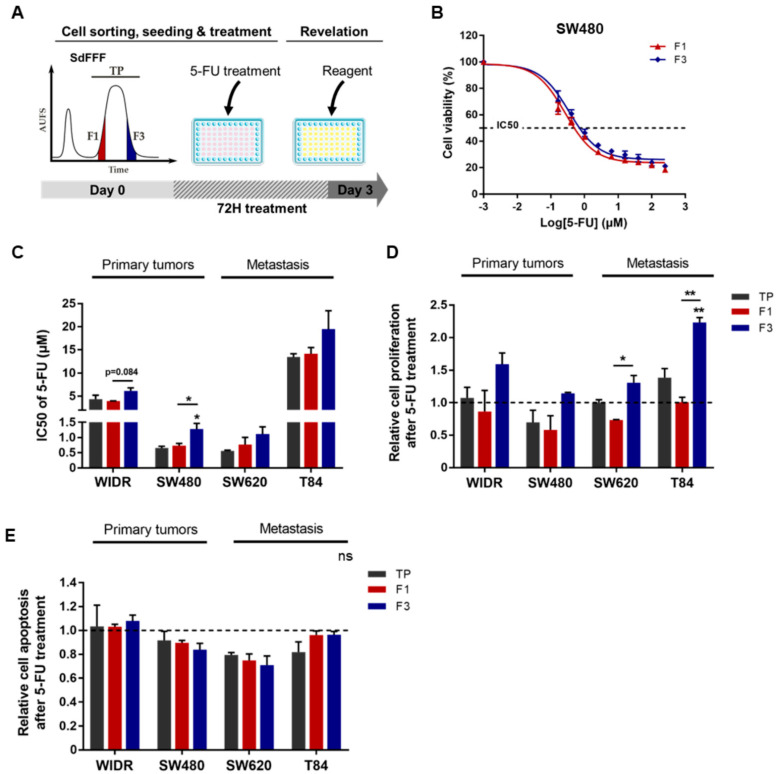
Figure 4.
5-FU resistance of F3 subpopulation from CRC cell lines. (A) Schematic representation of 5-FU response analysis performed. After cell sorting by SdFFF, cell subpopulations were treated with 5-FU for three days and then cell viability, proliferation, and apoptosis analyses were performed. (B,C) After 5-FU treatment, cell viability analyzed by MTT assay was presented as a dose–response curve for the SW480 cell line (B) and a bar plot with IC50 values obtained from all cell lines (C). (D) Cell proliferation rate after 5-FU treatment was measured by BrdU assay and presented in the bar plot as a ratio between treated and untreated conditions (dashed line). (E) After 5-FU treatment, apoptosis rate was measured using ELISA cell death assay and compared with the untreated condition (dashed line). All these results are represented as means ± SEM and statistical differences with ‘ns’ means a non-significant result both between the sorted cell subpopulations and between a sorted subpopulation and the control, * p-value < 0.05, ** p-value < 0.01, and * alone for significant results compared to TP using one-way ANOVA test.

