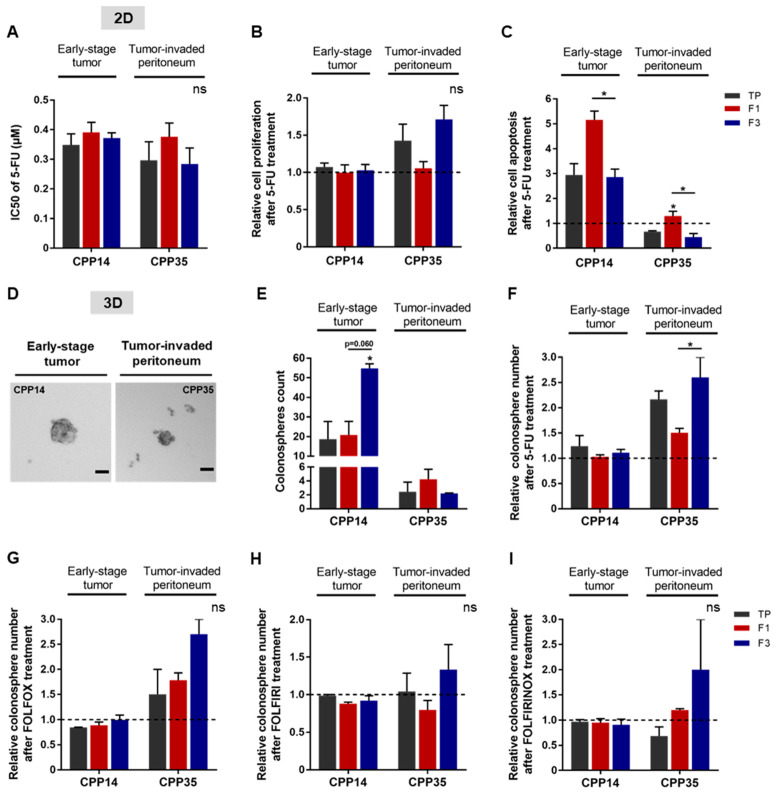
Figure 6.
Chemoresistance of F3 subpopulation from both primary cultures. (A) After 5-FU treatment, cell viability was analyzed by MTT assay and presented as a bar plot with IC50 values obtained from all primary cultures. (B) Post-treatment induced proliferation was assessed by BrdU assay, comparing the results to the untreated condition (dashed line). (C) The apoptosis rate of both primary cultures was analyzed by ELISA cell death assay. (D,E) The tumorigenic potential of cells in vitro was evaluated by a sphere formation assay. In untreated condition, the ability of primary cultures to form colonospheres was presented as images of formed colonospheres (D) and their quantification summarized in the bar plot (E). Scale bar 50 µm. (F–I) The impact of chemotherapies on CSC tumorigenic properties in vitro was investigated after treatment with 5-FU alone (F) or in combination: FOLFOX (G), FOLFIRI (H), or FOLFIRINOX (I). All these results are represented as means ± SEM and statistical differences with ns means a non-significant result both between the sorted cell subpopulations and between a sorted subpopulation and the control, * p-value < 0.05 and * alone for significant results compared to TP using one-way ANOVA test.

