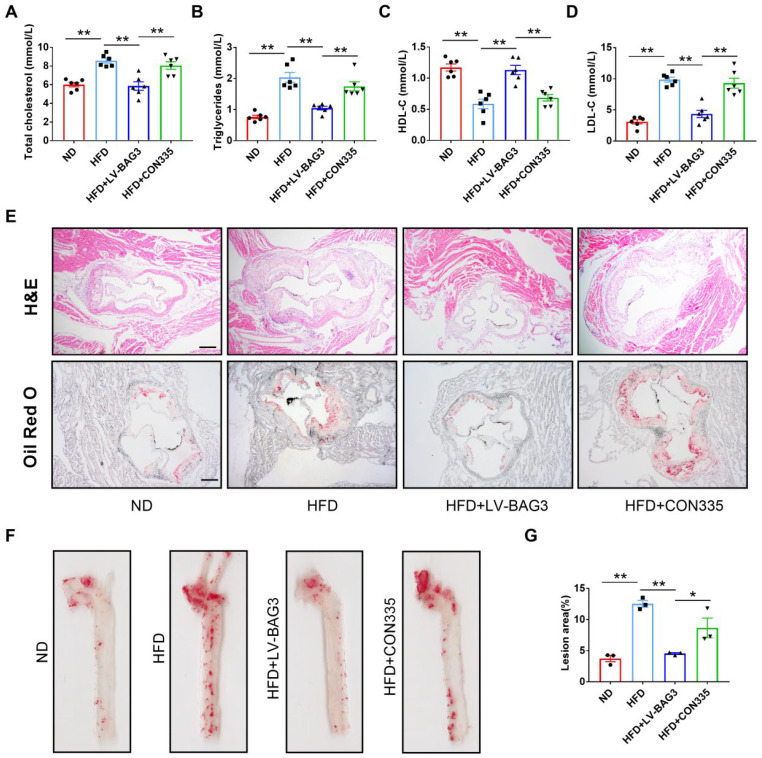
Figure 1.
Overexpression of BAG3 reduces atherosclerotic lesions in ApoE−/− mice. (A–D) The levels of serum TG, TC, HDL-C and LDL-C in mice (n = 6). (E) Hematoxylin–eosin (H&E) and Oil Red O staining of aortic root sections showing the atherosclerotic lesions and lipid deposition (scale bar indicates 200 μm) (n = 3). (F,G) Representative en face images of Oil Red O staining of aortas; the lesion area of the whole aorta was quantified (n = 3). The data are presented as the mean ± S.E.M. * p < 0.05, ** p < 0.01.

