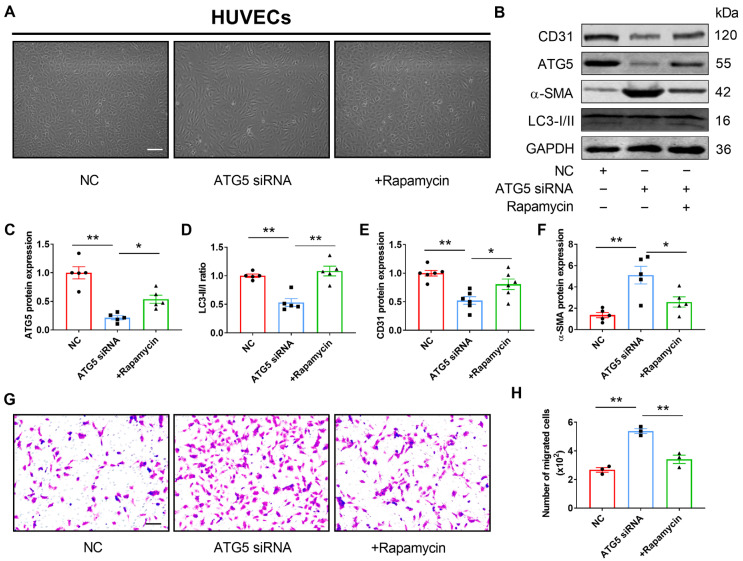
Figure 4.
Inhibition of autophagy induces EndMT in HUVECs. (A) Morphological changes post the indicated treatments were observed under the microscope (scale bar indicates 100 µm) (n = 3). (B–F) ATG5, CD31, and α-SMA protein expressions and the LC3-II/LC3-I ratio were detected using Western blotting. Fold changes are shown (n = 5). (G,H) Transwell cell invasion assay was performed to analyze the migration ability of cells (scale bar indicates 100 µm) (n = 3). The data are presented as the mean ± S.E.M. * p < 0.05, ** p < 0.01.

