Figure 1.
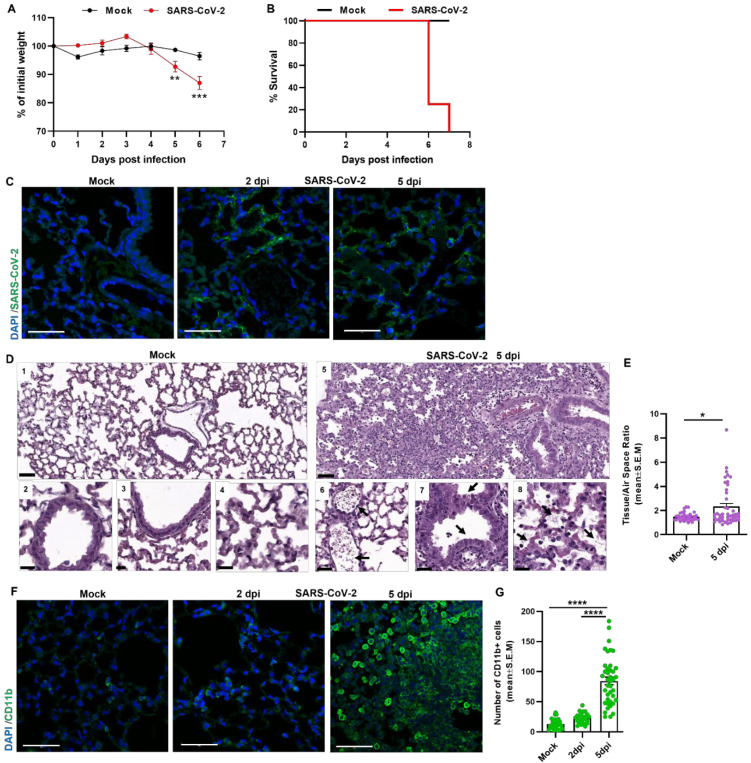
K18-hACE2 mouse model for airways infection with SARS-CoV-2. (A) Body weight changes of i.n mice infected with 2000 pfu of SARS-CoV-2 compared to mock (n = 6 for Mock and SARS-CoV-2, the error bars represent the SEM), and (B) survival rate as depicted by Kaplan–Meier survival curves (n = 20). Weight differences between groups were analyzed by two ways ANOVA (group × time, with repeated measure on the latter) followed by an appropriate post hoc analysis (Dunnett) using GraphPad 7. ** p < 0.01, *** p < 0.001. (C) Representative SARS-CoV-2 immunolabeling of lung sections of mock and SARS-CoV-2-infected mice at 2 and 5 dpi. (Scale bar 50 µm). (D) H&E staining of lung sections from K18-hACE2 mice, mock or 5 days post infection (dpi). Upper images show low magnification (scale bar 100 µm) and lower images show high magnification (scale bar 50 µm). (E) Tissue/Air space ratio analysis of mock and SARS-CoV-2-infected mice (5 dpi), (n = 7 for Mock and n = 8 for SARS-CoV-2), for each mouse five fields were imaged and analyzed. The error bars represent the SEM. Statistical significance was calculated using one tailed Mann Whitney non-parametric statistics * p < 0.05. (F) Representative immunofluorescence images of 5 µm lung sections labeled for immune cells marker-CD11b (green) of mock and SARS-CoV-2-infected mice at 2 and 5 dpi. (Scale bar 50 µm). (G) Quantitative analysis of CD11b+ cells in lung sections of mock and SARS-CoV-2-infected mice at 2 and 5 dpi (n = 6 for mock and n = 5 for 2 and n = 8 for 5 dpi), for each mouse five fields were imaged and analyzed. The error bars represent the SEM. Statistical significance was Kruskal–Wallis nonparametric test. **** p < 0.0001.

