Figure 2.
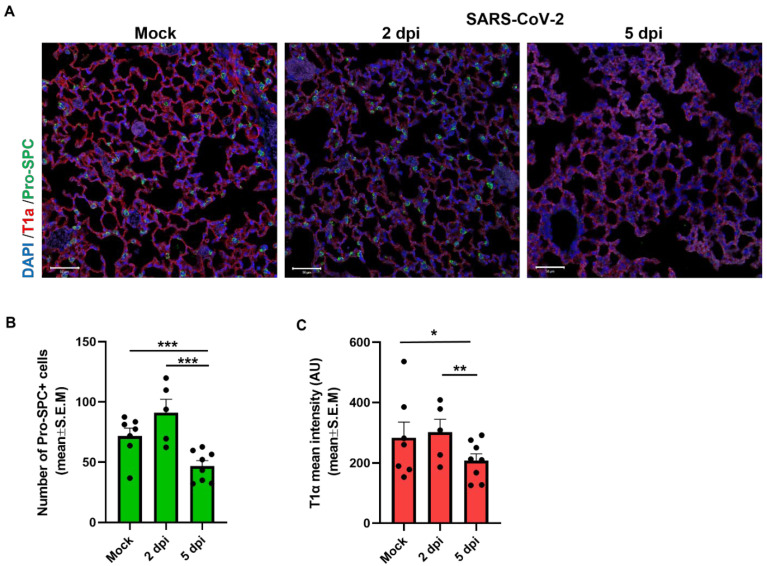
Immunophenotype of alveolar epithelial cells in lung sections of SARS-CoV-2-infected K18-hACE2 mice. K18-hACE2 mice were infected with 2000 pfu of SARS-CoV-2 compared to mock. (A) Representative immunofluorescence images of lung sections labeled for alveolar type I (red) and type II (green) cells at 2 and 5 days post SARS-CoV-2 infection compared to mock treated mice. (B) Quantitative analysis of number of type II epithelial cells (Pro-SPC+). (C) Mean fluorescence intensity of type I epithelial (T1α+) cells expression in lung sections of mock and SARS-CoV-2-infected mice at 2 and 5 dpi (n = 7 mice for mock and n = 5 for 2 dpi and n = 8 for 5 dpi). Scale bars: 50 µm. Data presented with analysis of five fields per mouse. Statistical significance was calculated using Kruskal–Wallis nonparametric test. * p < 0.05, ** p < 0.005, *** p < 0.0001.

