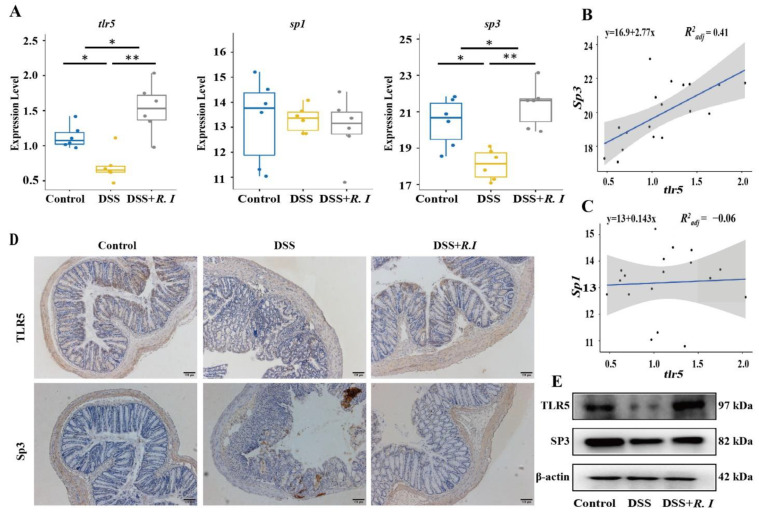
Figure 3.
Expression levels of the flagellin recognition receptor TLR5 and its potential transcription factor in the control, DSS and DSS + R. I groups treated mice. (A) Expression levels of TLR5, Sp1, and Sp3 in the three groups as determined by RT–qPCR analysis. (B) Correlation analysis between TLR5 and Sp3 in the three groups. (C) Correlation analysis between TLR5 and Sp1 in the three groups. (D) Representative images of TLR5 and Sp3 immunohistochemical staining in colon sections from the three groups. (E) Representative Western blot analysis showing TLR5 and Sp3 in colon sections from the three groups. Control vs. DSS, Control vs. DSS + R. I, and DSS vs. DSS + R. I; * p < 0.05 and ** p < 0.01.

