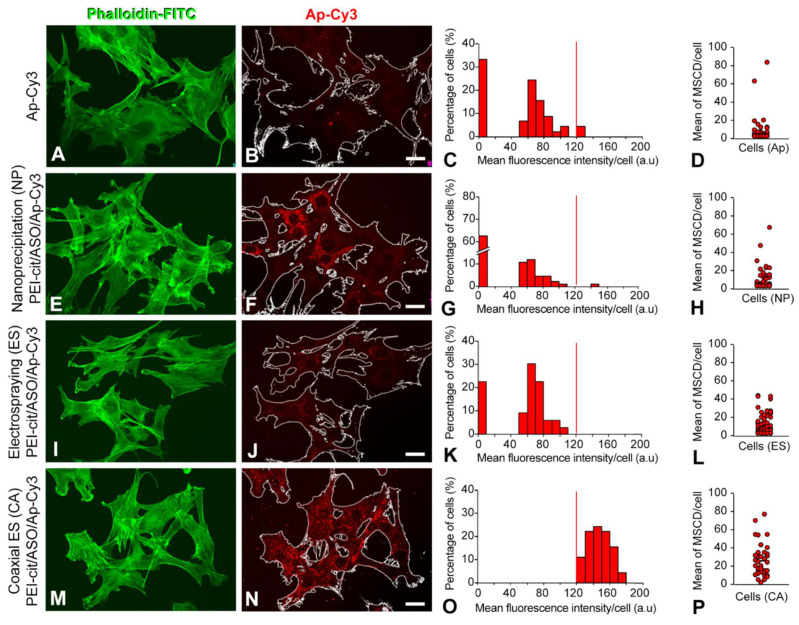
Figure 4.
(A,E,I,M) Confocal images showing the actin filaments (FITC-conjugated phalloidin) of the cytoskeleton from C2C12 cells. (B,F,J,N) Analogous confocal images showing the same C2C12 cells outlined transfected with either free Cy3-conjugated aptamer (B) or with the PEI-cit/ASO/Ap-Cy3 nanocomplexes synthetized by nanoprecipitation ((E), NP), electrospraying ((I), ES), and coaxial electrospraying ((N), ES). (C,G,K,O) Mean fluorescence intensity histogram of the Cy3 aptamer signal only from nanocomplexes located at MSCD. Vertical red lines correspond to the threshold limit that discriminates the MFI corresponding to MSCD of areas above and below 0.5 µm2. (D,H,L,P) Dispersion diagram of the mean number of MSCD of mean area ≥ 0.5 µm2 per cell. Note that most cells transfected with free aptamer (D), do not exhibit MSCD. Conversely, all cells transfected with CA nanocomplexes enclosed at least 1 MSCD in their cytoplasm. Scale bar: 20 µm.

