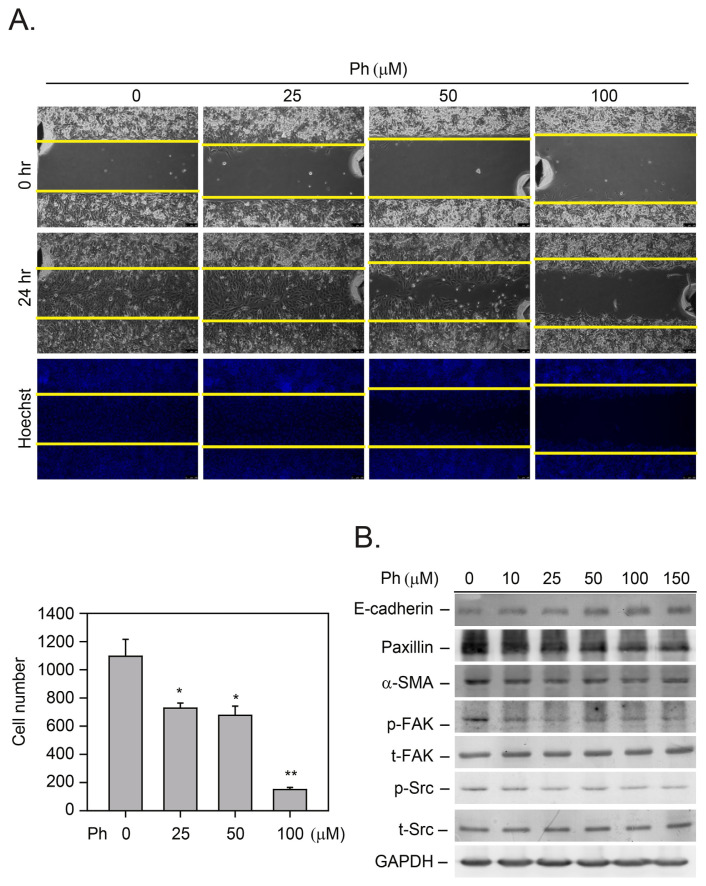
Fig. 3.
The mechanisms of Ph-induced TNBC cell migration. (A) The MDA-MB-231 tumor cells were treated with Ph (25–100 μM) for 24 h, and tumor cell growth and migration was calculated by the wound-healing method. The data were analyzed by paired t-tests. The mean value determined from the DMSO-treated cells was significantly different from that of Ph-treated cells (*p = 0.05 for all comparisons). (B) Total protein from the Ph-treated cells was harvested for detection of proteins related to cell migration by immunoblotting analysis. Membranes were also probed with anti-GADPH antibodies to correct for differences in protein loading. All results presented above were repeated at least three times, and representative results are shown.

