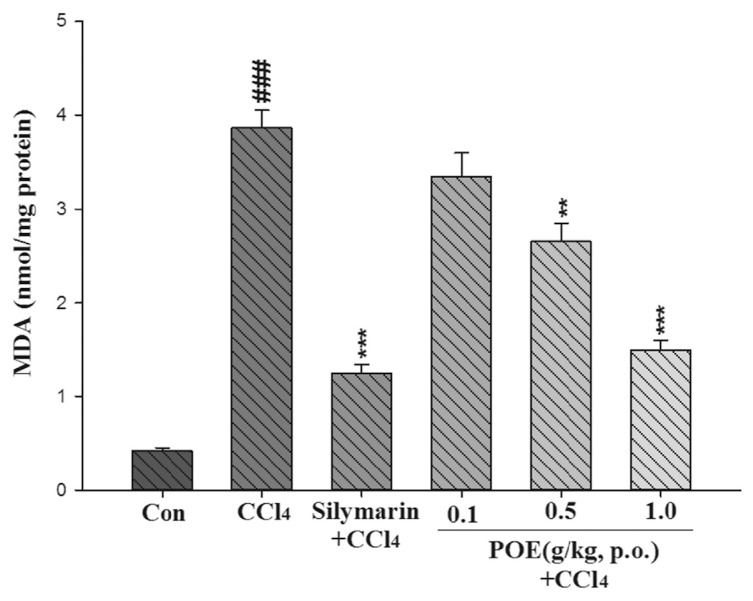
Fig. 7.
Effect of silymarin (0.2 g/kg) and POE (0.1, 0.5, 1.0 g/kg) on level of malondialdehyde (MDA) induced with CCl4 in the mice liver. Values are mean ± SEM (n = 10). #Indicates significant difference from the control group (Con) (###p < 0.001).
*Indicates significant difference from the CCl4 group (**p < 0.01, ***p < 0.001).

