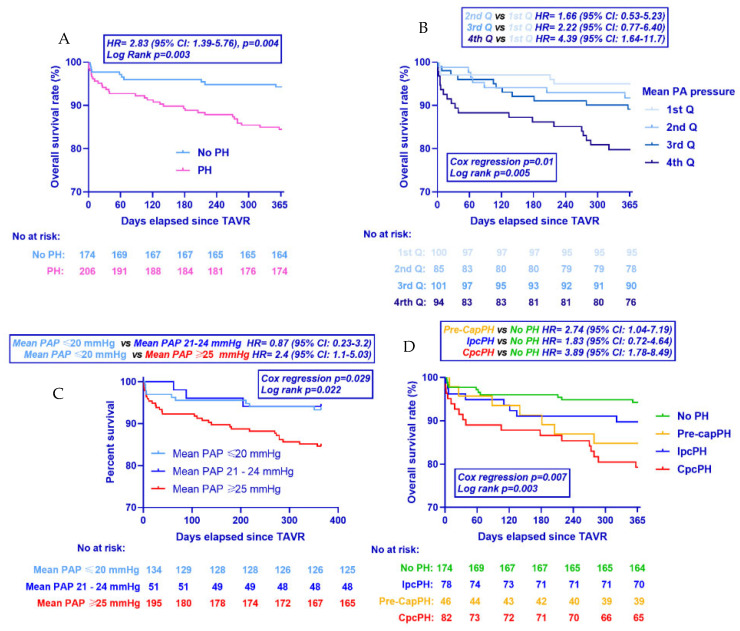
Figure 2.
Kaplan–Meier curves for all-cause mortality at 1 year. Population stratified according to (A) whether PH was present or not, (B) mPAP quartiles, (C) the presence of mean PAP between 21 and 24 mmHg and (D) hemodynamic type of PH. HR: hazard ratio; p values refer to unadjusted hazard ratios from Cox regression analysis. CI: confidence intervals; TAVR: Transcatheter Aortic Valve Replacement. PH: Pulmonary hypertension; AS: Aortic stenosis; PA; Pulmonary artery.

