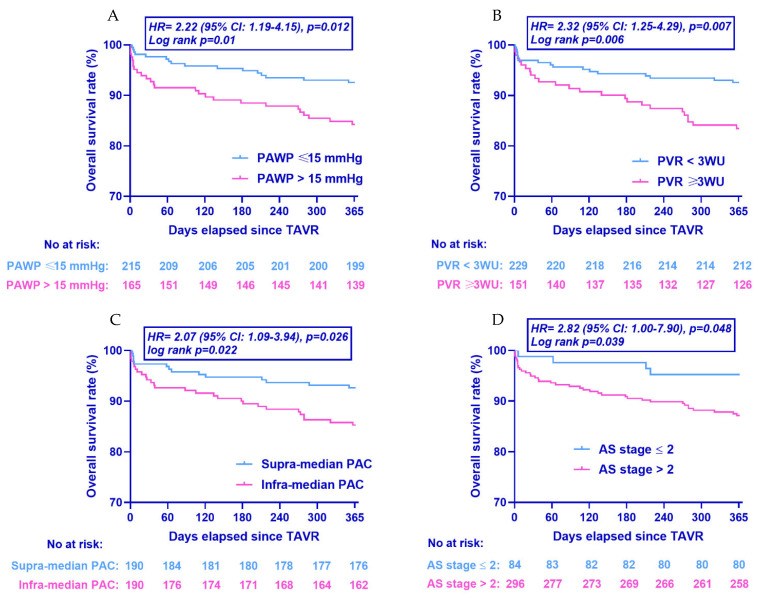
Figure 3.
Kaplan–Meier curves for all-cause mortality at 1 year. Population stratified according to (A) PAWP, (B) PVR, (C) PAC, and (D) AS staging. HR: hazard ratio; p values refer to unadjusted hazard ratios from Cox regression analysis. CI: confidence intervals; TAVR: Transcatheter Aortic Valve Replacement; PAWP: Pulmonary artery wedge pressure; PVR: Pulmonary vascular resistance; PAC: Pulmonary artery compliance; AS: Aortic stenosis.

