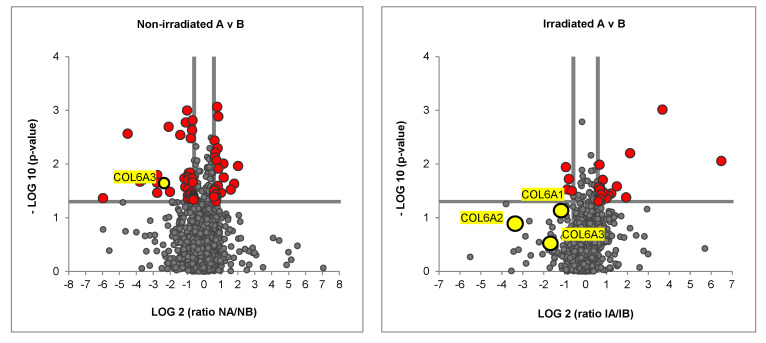
Figure 2.
Proteomic Analysis of non–irradiated and irradiated co-cultures. Volcano plot showing significantly differently abundant proteins in irradiated TNBC matrix versus irradiated healthy matrix (red data points). Three yellow data points below the horizontal line of significance represent the three strands of collagen VI, COL6A1, COL6A2 and COL6A3.

