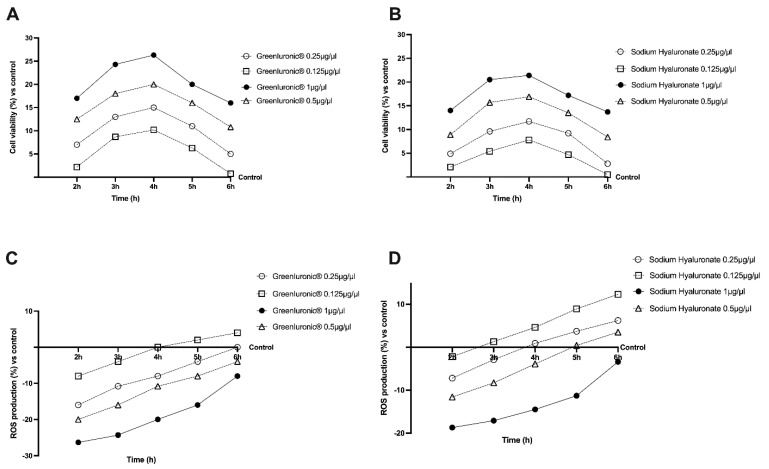
Figure 3.
Cell viability and ROS production on CaCo-2 cells. In panel (A,B) dose–response study on cell viability measured by MTT test of both GreenIuronic® and Sodium Hyaluronate from 2 to 6 h. In panel (C,D) ROS production of both GreenIuronic® and Sodium Hyaluronate measured by reduction in cytochrome C from 2 to 6 h. Data are mean ± SD of five independent experiments performed in triplicates vs. control values (0% line).

