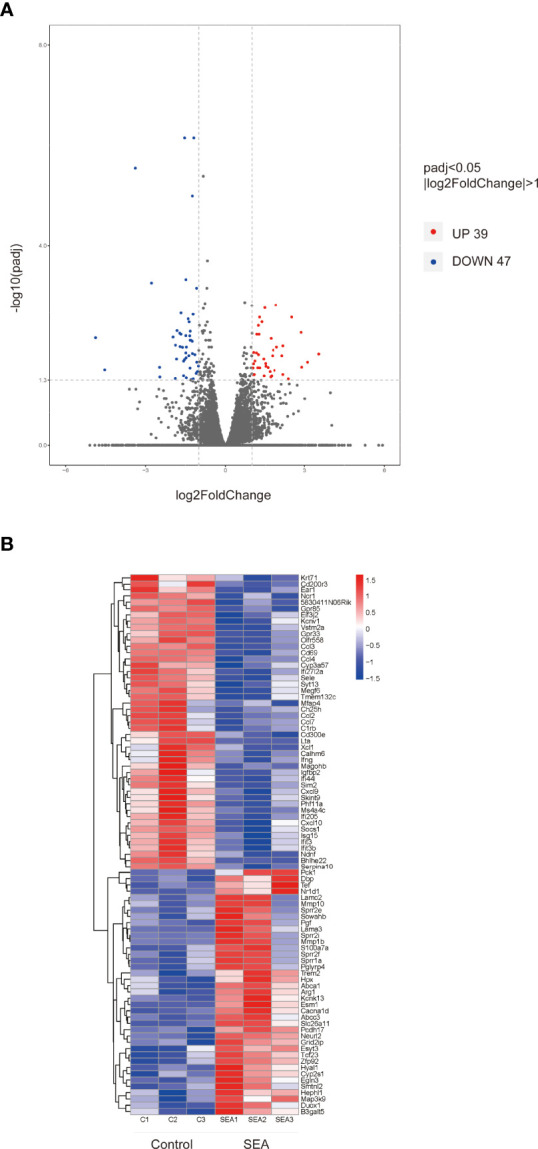
Figure 2.

Volcano map and hierarchical clustering heat map of DEGs. (A) (|log2Foldchange|>1, p adj < 0.05) DEG volcano distribution map; red represents upregulated transcripts; blue represents downregulated transcripts. (B) Hierarchical clustering heat map of DEGs (n = 3) in each group.
