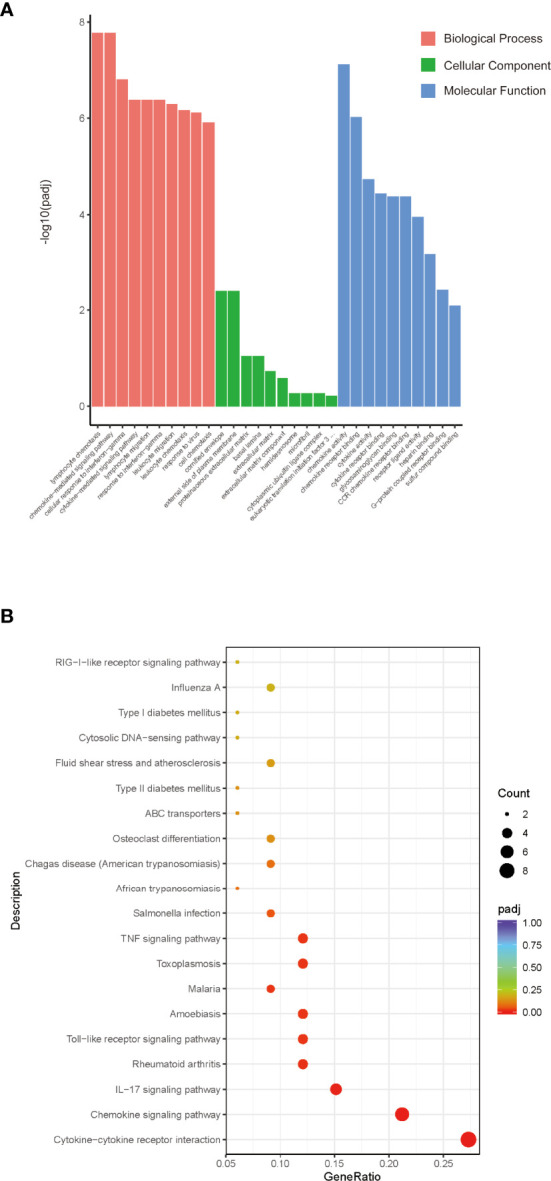
Figure 3.

GO and KEGG analysis of the role of DEGs and screening enrichment pathways. (A) From the aspects of biological processes, cellular components, and molecular functions, select the top 10 most significant terms and draw a histogram for display. The abscissa in the figure is the description of GO Term, and the ordinate is the significance level of GO Term enrichment. The higher the value, the more significant. Orange represents BP, green represents CC, and blue represents MF. (B) Select the 20 most significant KEGG pathways to draw a scatter diagram for display. The abscissa in the figure is the ratio of the number of differential genes annotated to the KEGG pathway to the total number of differential genes, the ordinate is the description of the KEGG pathway, the size of the dot represents the number of genes annotated to the KEGG pathway, and the color from red to purple represents enrichment of the saliency size.
