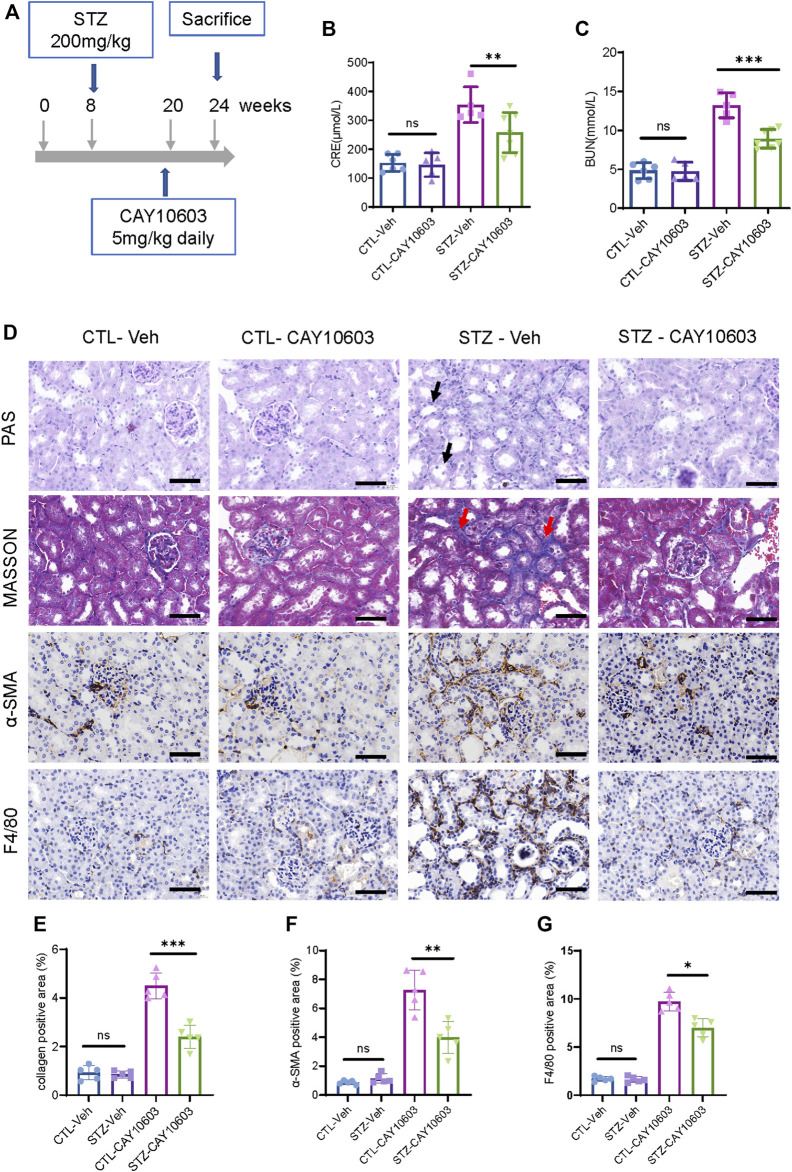
FIGURE 5.
CAY10603 delays kidney function decline in the late stage of diabetic mice. (A) Schematic diagram of experimental design. (B) Serum creatinine and (C) serum BUN in different groups as indicated. (D) Representative images of PAS staining, Masson staining, and IHC staining of α-SMA and F4/80. (E) Quantification of the positive area for Masson staining. (F) Quantification of the positive area for α-SMA IHC staining. (G) Quantification of the positive area for F4/80 IHC staining. *p < 0.05; **p < 0.01; ***p < 0.001. Scale bar, 100 µm. Two-way ANOVA. CTL, control; Veh, vehicle.

