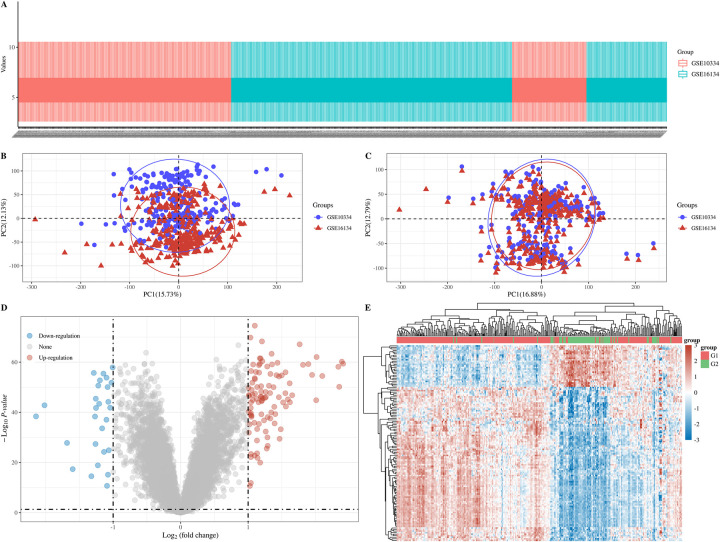
Fig 1.
A: Box plot, GSE10334 is shown in red and GSE16134 is shown in blue; B: PCA results before batch removal; C: PCA results after batch removal; D: Volcano plots, and |log2(FC)|>1, the over-expressed mRNAs are shown in red and the down-expressed mRNAs are shown in blue, the ordinate represents -log10 P-value; E: Hierarchical clustering analysis of mRNAs, different colors represent different expression trends, G1: Affected; G2: Unaffected.

