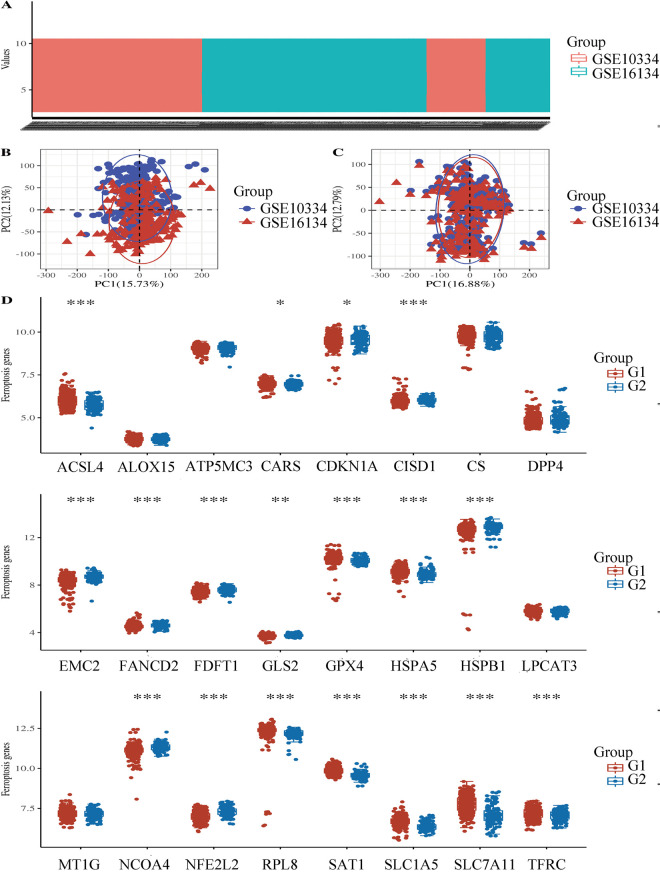
Fig 2.
A: Box plot, GSE10334 is shown in red and GSE16134 is shown in blue; B: PCA results before batch removal; C: PCA results after batch removal; D: The expression distribution of Ferroptosis-related mRNA in case and control groups, where the horizontal axis indicates the name of mRNA, the vertical axis indicates the expression of mRNA, and the upper left corner represents the significance p-value test method. Asterisks represent levels of significance *p-value < 0.05, **p-value < 0.01, ***p-value < 0.001.

