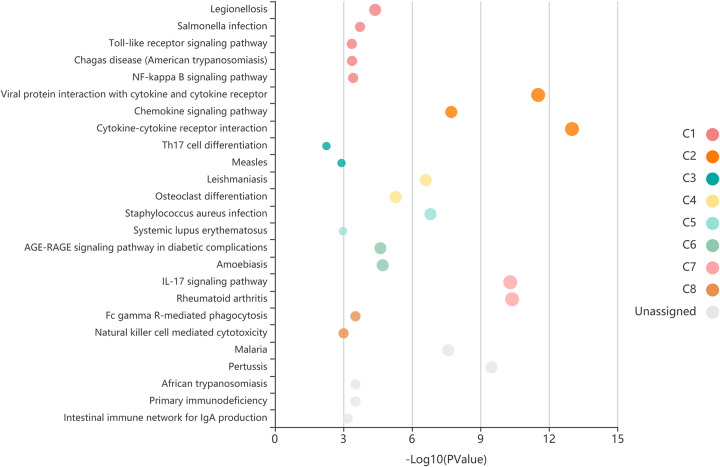
Fig 5. Each bubble which represents an enriched function is according to the number of input genes in this term.
The size of the bubble represents the different significance levels. The different color of the bar and bubbles represent different modules, named C1-C8. If there are more than 5 terms in each module, top 5 with the highest enrich ratio will be displayed.

