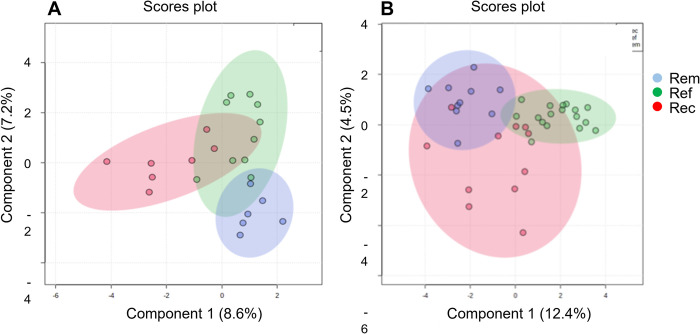
Fig 5. Sparse-PLSDA analysis of pre- and posttreatment samples by clinical outcome group.
Normalized, unfiltered data was log10 transformed in MetaboAnalyst.ca platform. (A) pretreatment reiterative sPLSDA analysis using the integration of the major Gardnerella species. The top 23 species S8a Table in S3 File from the initial sPLSDA analysis were input into a second sPLSDA analysis to generate the result shown here. (B) posttreatment reiterative sPLSDA analysis using the unintegrated NGS counts dataset. The shaded zones represent the range of two-component values with the 95% confidence intervals of observed data for each outcome group.

