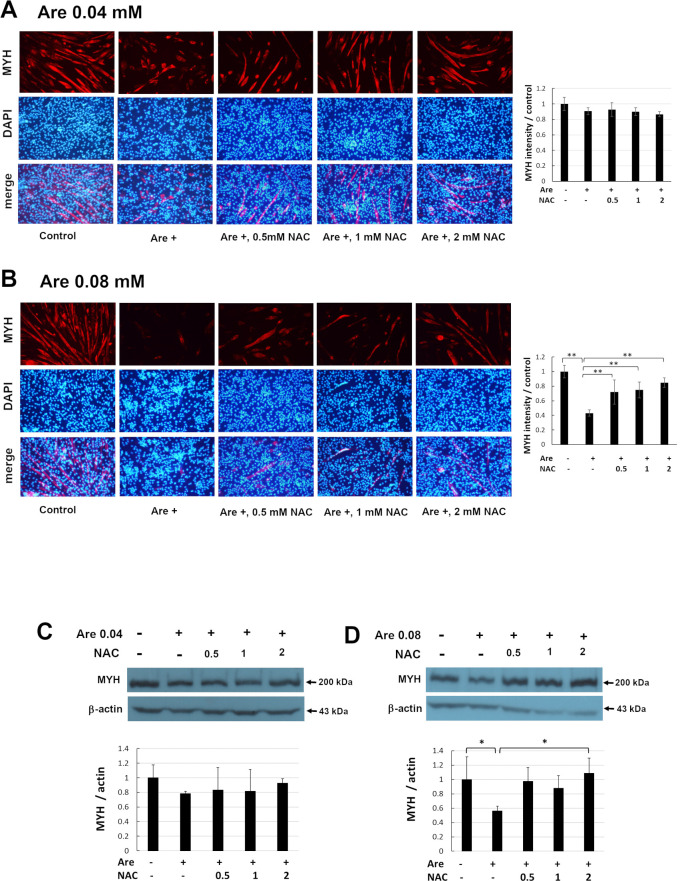
Fig 5. Effect of NAC on decreased MYH expression caused by arecoline in C2C12 cells.
The C2C12 cells were cultured in differentiation medium with 0–2 mM NAC and 0.04 mM (A, C) or 0.08 mM (B, D) arecoline for 7 days. The distribution of MYH was examined by immunofluorescence under a fluorescence microscope (A and B, left, upper panel). Scale bar represents 100 μm at 100x magnification. Nuclei in the same field were counterstained with DAPI (A and B, left, middle panel). The images of MYH and DAPI were merged (A and B, left, lower panel). The intensities of MYH were quantified and normalized to the no-treatment control from random images of three independent experiments (Fig 5A and 5B, right panels). The values of ANOVA with 0.04 and 0.08 mM were (F4,10 = 2.73, P = 0.09) and (F4,10 = 14.49, P = 3.63E-04). The expression of MYH protein was detected by Western blotting (C and D, upper panel). β-actin served as a loading control. The band intensities of MYH from three independent experiments were quantified and normalized to no-treatment control (C and D, lower panel). The values of ANOVA with 0.04 and 0.08 mM were (F4,10 = 0.63, P = 0.65) and (F4,10 = 5.15, P = 0.02) (mean ± SD; *p < 0.05; **p < 0.01, as compared to cells treated only with arecoline, Tukey HSD test).

