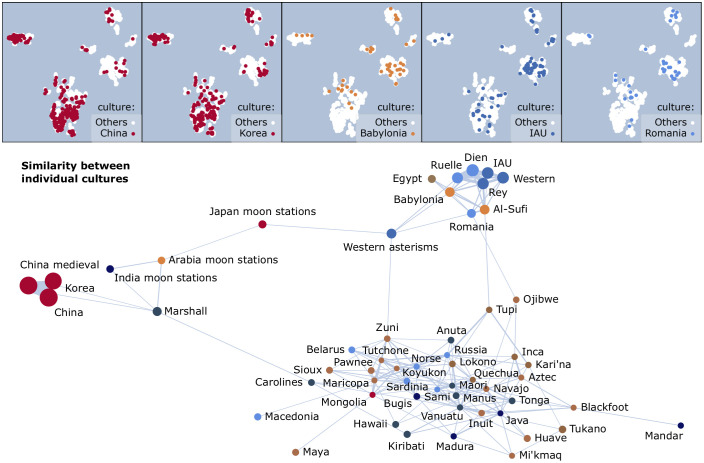
Fig 6. Visual signatures by culture (question I.1).
(top) Constellations from example cultures are shown in the foreground, over the background of all other constellations. (bottom) The similarity graph for cultures. The node size is proportional to the number of constellations per culture, and the edge width to the similarity Δ.

