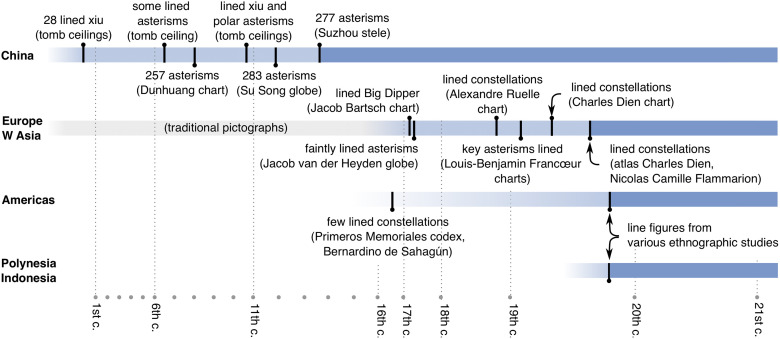
Fig 11. Regional timeline for line figures.
The centuries AD are marked at the bottom, on a non-linear scale. Dark blue time intervals are recent periods, during which line figures are documented. They are preceded by periods of development or transition (in light blue), during which important sources for line figures are marked. In E Asia, the circle-and-line representation is native. In Europe and W Asia, line figures developed out of pictographs, alongside the development of modern astronomy. In the Americas and the Pacific, they were likely introduced under Western influence.

