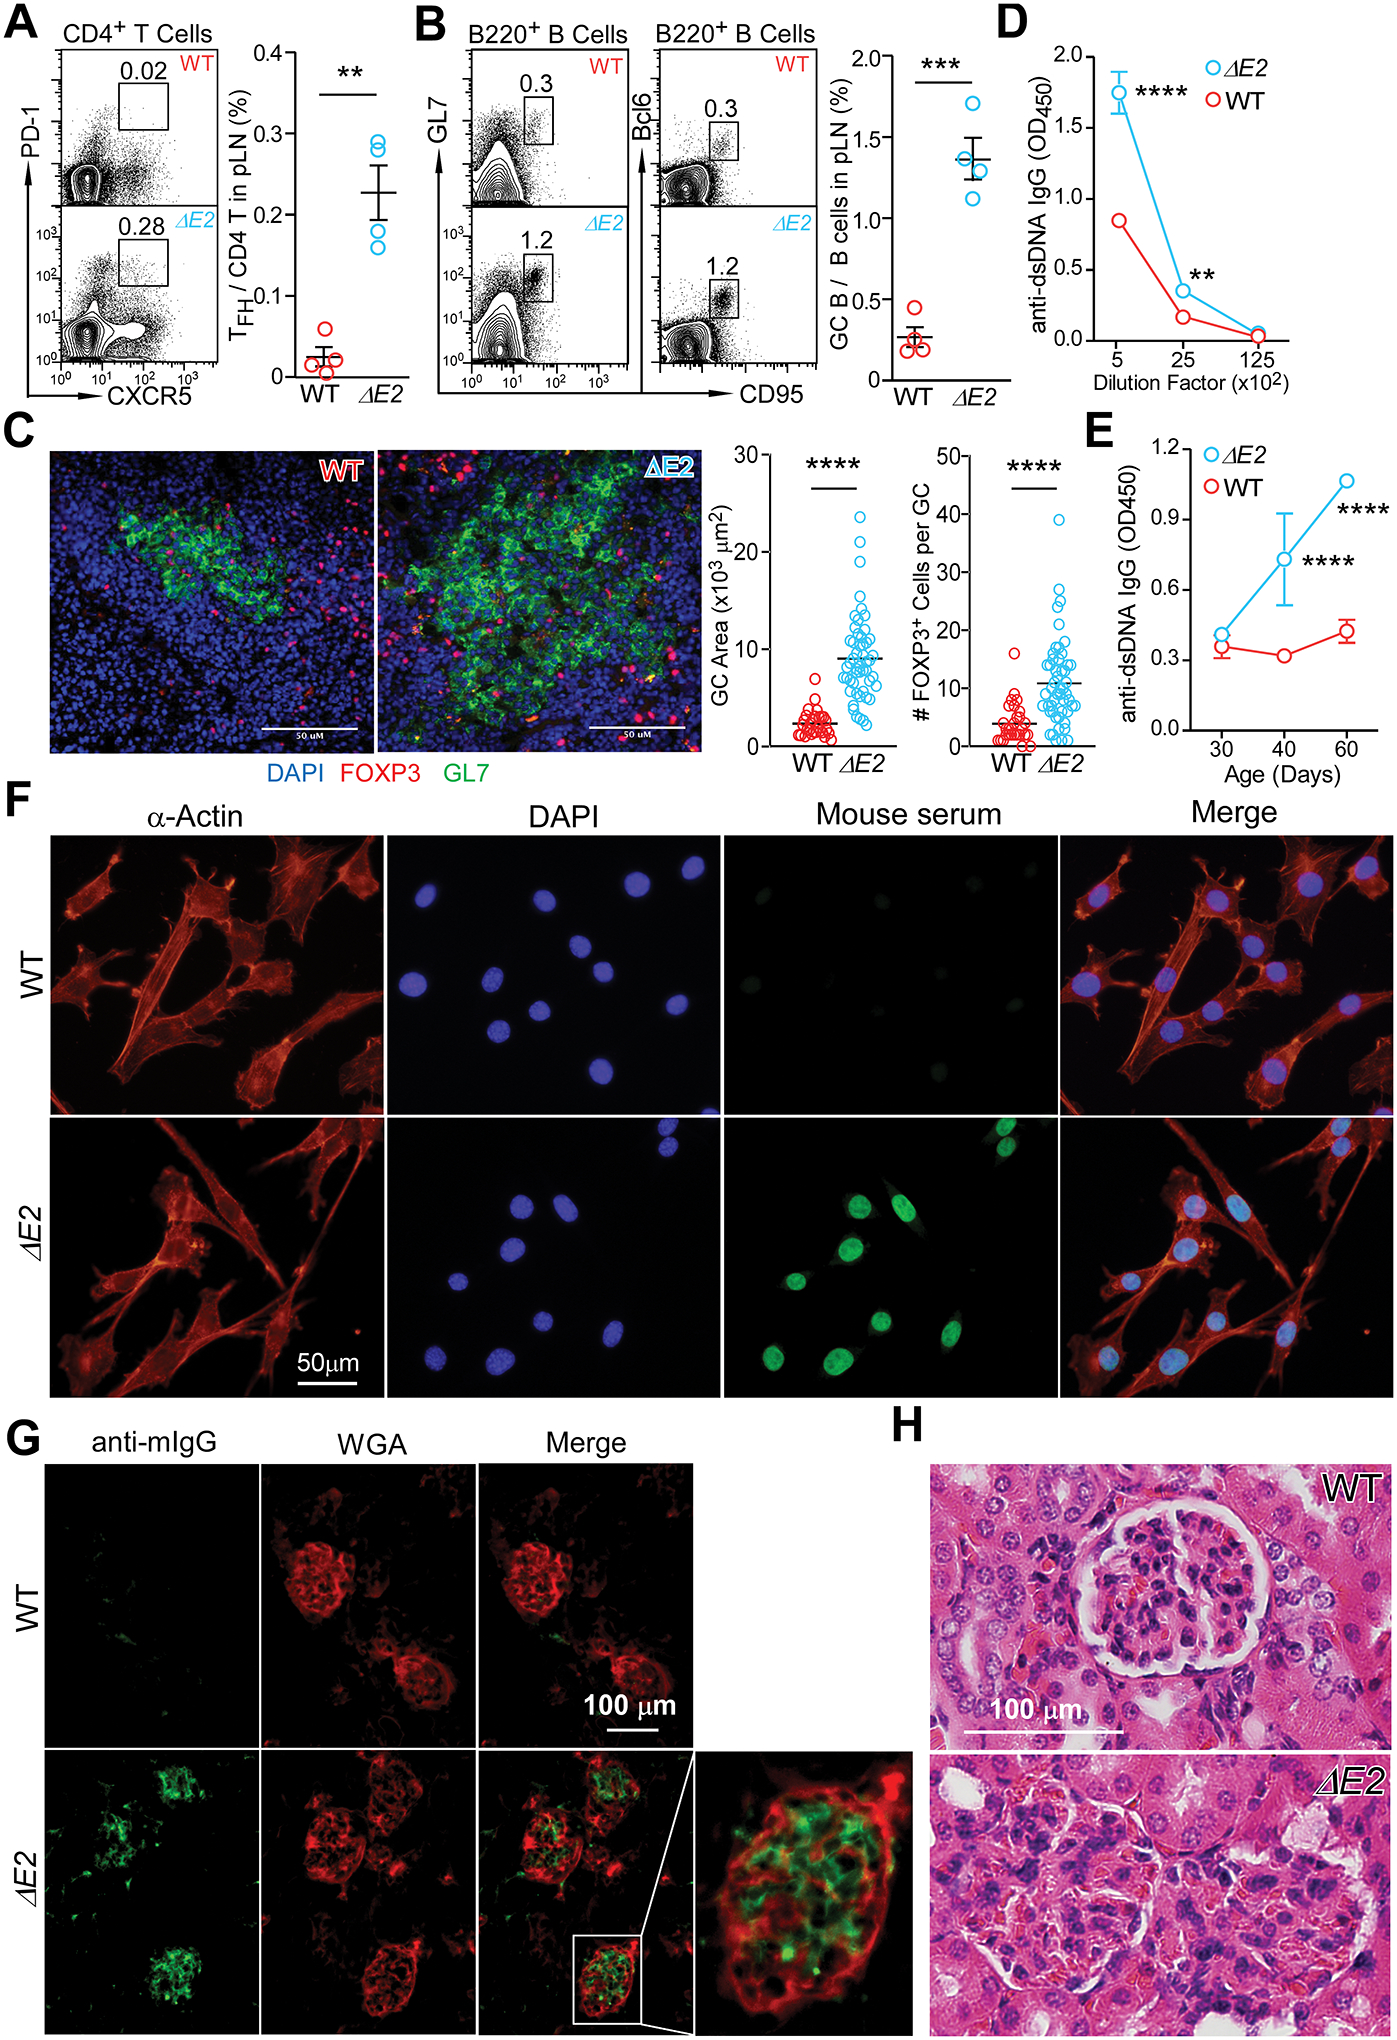
Figure 3. Foxp3 exon 2 deletion results in a systemic autoimmune disease.

(A) Flow cytometric analysis of CD4+PD-1+CXCR5+ follicular helper T cells (TFH) in peripheral lymph nodes of WT and Foxp3 ΔE2 mice. (B) Flow cytometric analysis of B220+GL-1+CD95+Bcl6+ germinal center B (GC B) cells in peripheral lymph nodes of WT and Foxp3 ΔE2 mice. (C) Spontaneous germinal centers in WT and Foxp3 ΔE2 mice were examined by immunohistochemistry. Representative images (left) and quantification of GCs (right). (D) ELISA quantification of anti-dsDNA IgG in the serum of WT and Foxp3 ΔE2 mice (n = 6–7). (E) Time course of anti-dsDNA IgG in the serum of Foxp3 ΔE2 mice. Sera from WT and Foxp3 ΔE2 mice at indicated ages were diluted at 1:500 (n = 10 mice). (F) Representative images of serum anti-ANA IgG (at 1:160 dilution of serum) detected with fixed mouse 3T3 fibroblast cells. Mouse serum: sera collected from WT or Foxp3 ΔE2 mice were used as primary antibody and FITC anti-mouse IgG was used as secondary antibody to detect the existence of anti-ANA IgG in sera. (G) Immunofluorescence of kidney glomerulus sections showing IgG deposits in Foxp3 ΔE2 mice. WGA: wheat germ agglutinin. (H) Kidney glomerulus sections stained with hematoxylin and eosin (H&E). Data represent mean ± SEM (A-B) or mean ± SD (D&E) from one of ≥ 2 independent experiments. **: p < 0.01; ***: p < 0.001; ****: p < 0.0001 by two-tailed t-test (A-C) or two-way ANOVA with Bonferroni post-hoc test (D&E).
