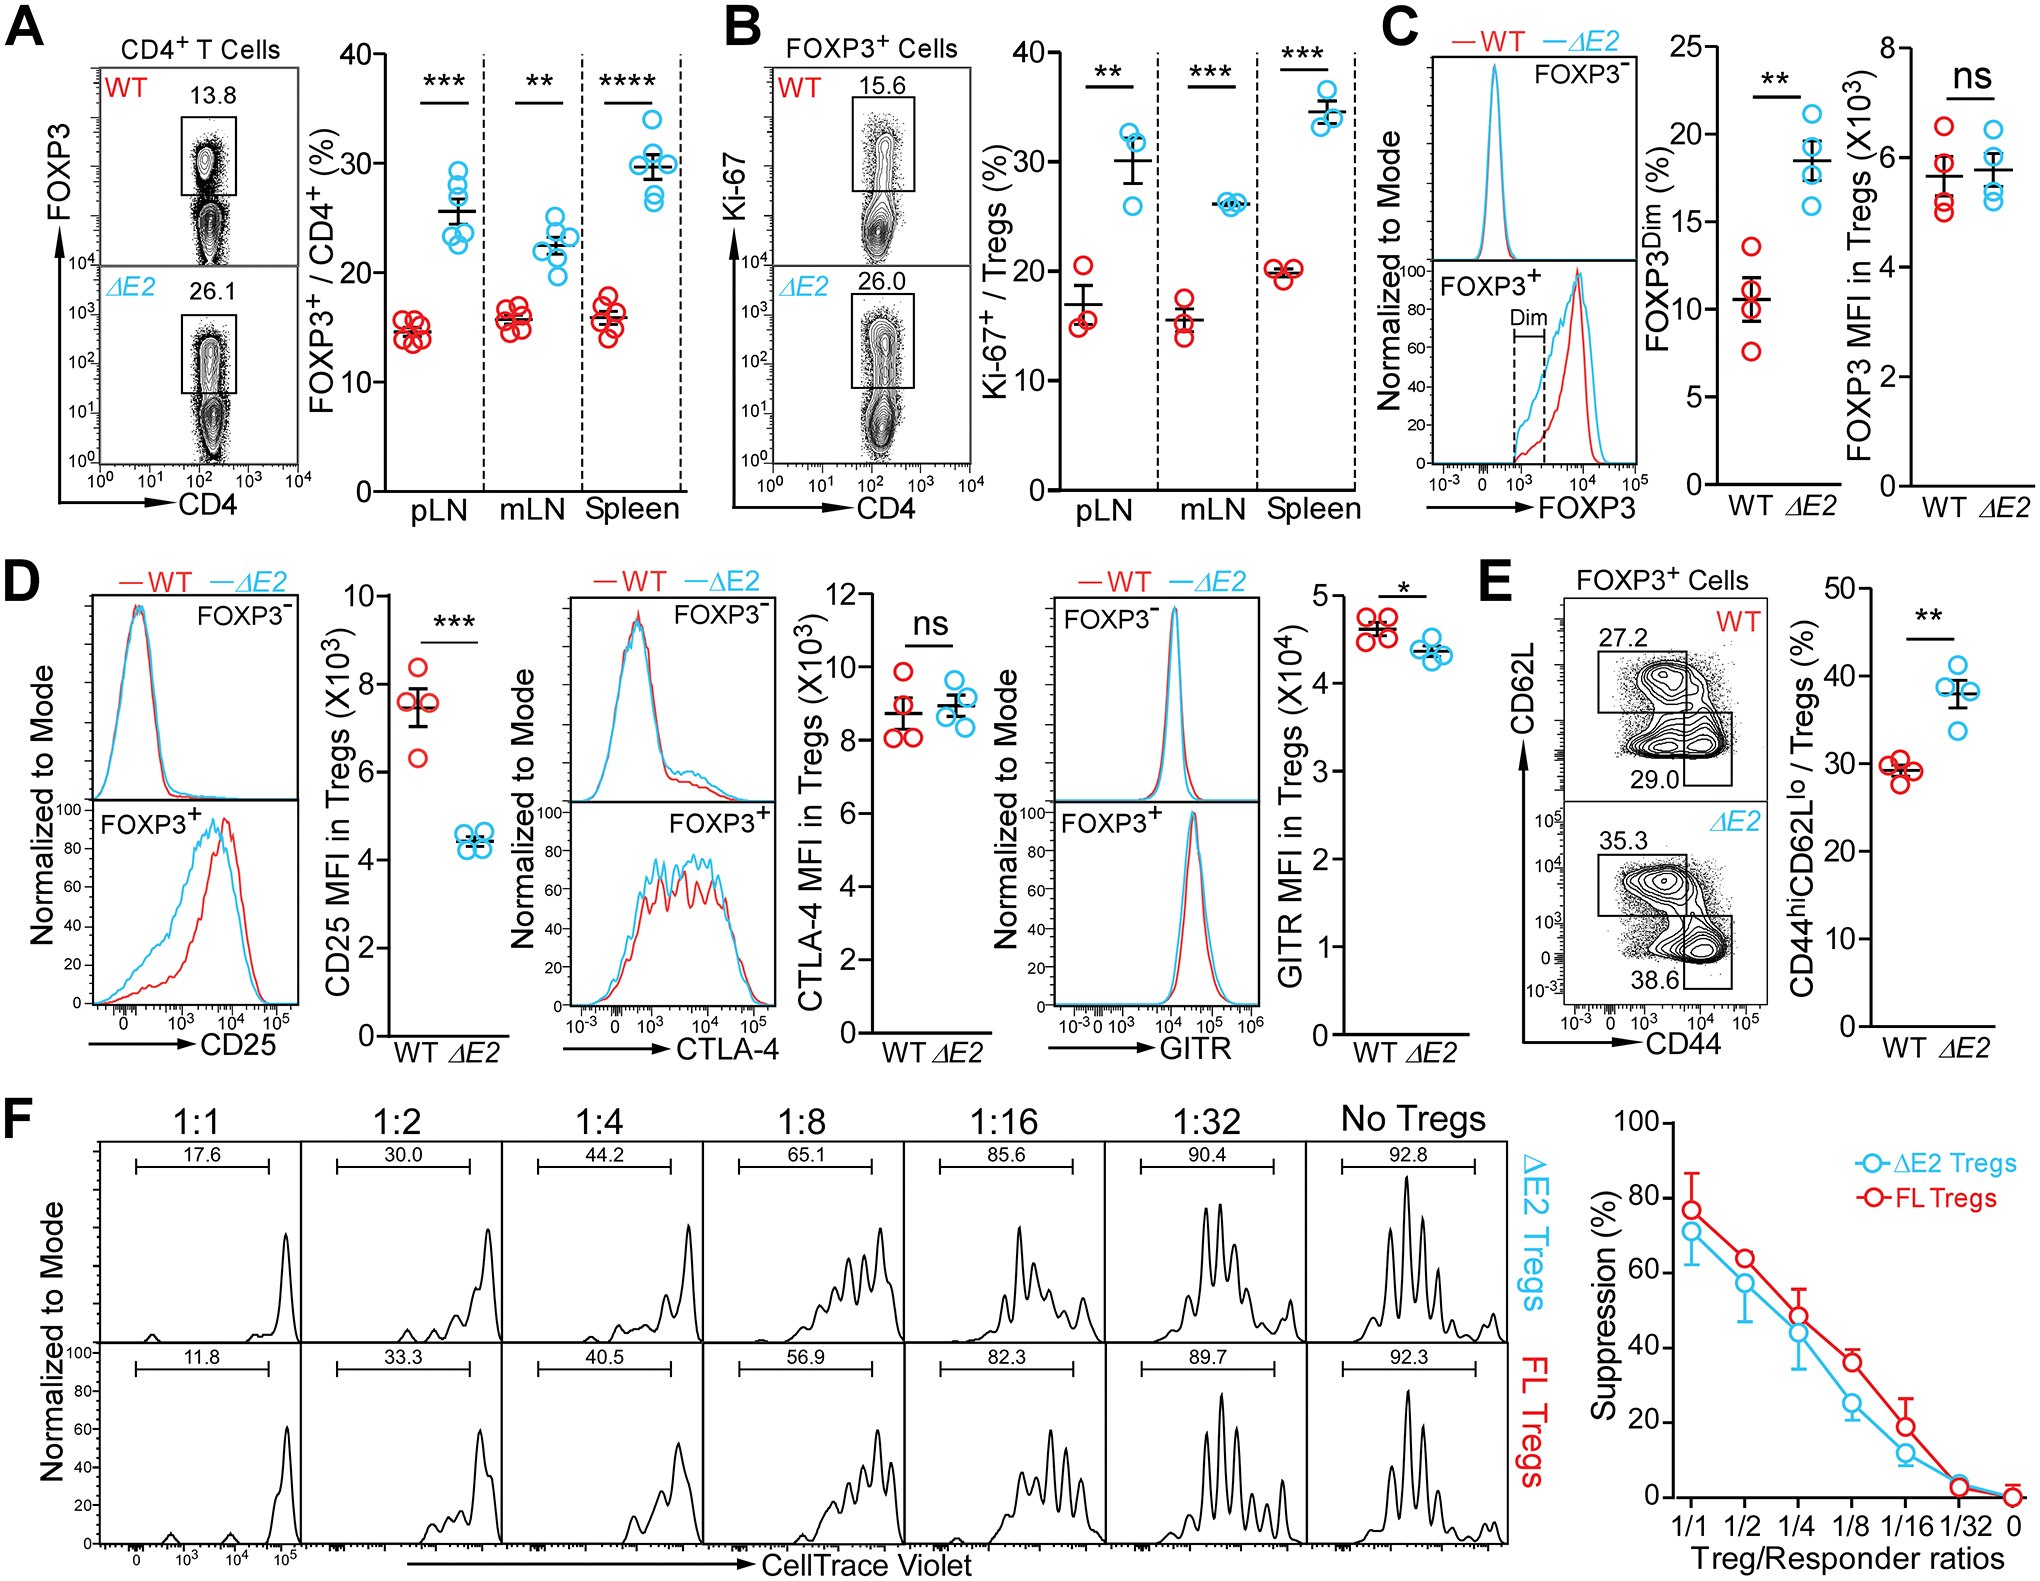
Figure 4. FOXP3 ΔE2 Tregs display more activated phenotypes, reduced phenotypic markers, but similar suppressive function.

(A) Flow cytometric analysis of Treg frequencies in secondary lymphoid organs of WT and Foxp3 ΔE2 mice. (B) Proliferation of Treg cells in WT and Foxp3 ΔE2 mice as marked with Ki-67 expression. (C) Mean fluorescent intensity (MFI) of FOXP3 and percentage of FOXP3Dim in Treg cells of WT and Foxp3 ΔE2 mice. (D) Mean fluorescent intensity (MFI) of CD25, CTLA-4 and GITR in Treg cells of WT and Foxp3 ΔE2 mice. (E) Flow cytometric analysis of CD44 and CD62L in Treg cells of WT and Foxp3 ΔE2 mice. Data in (A - E) represent mean ± SEM from one of ≥ 2 independent experiments. **: p < 0.01; ***: p < 0.001; ****: p < 0.0001 by multiple t-tests (A & B) or two-tailed t-test (C – E). (F) Suppressive function of Foxp3 ΔE2 Tregs vs Foxp3 FL Tregs in vitro. Tregs were FACS purified from Foxp3 ΔE2;BAC-Foxp3eGFP and Foxp3 FL;BAC-Foxp3eGFP mice. Data represent mean ± SEM (n = 3 mice) from one of 2 independent experiments. Means were compared by two-way ANOVA with Bonferroni post-hoc test. No difference in suppression by FOXP3 ΔE2 and FOXP3 FL Tregs.
