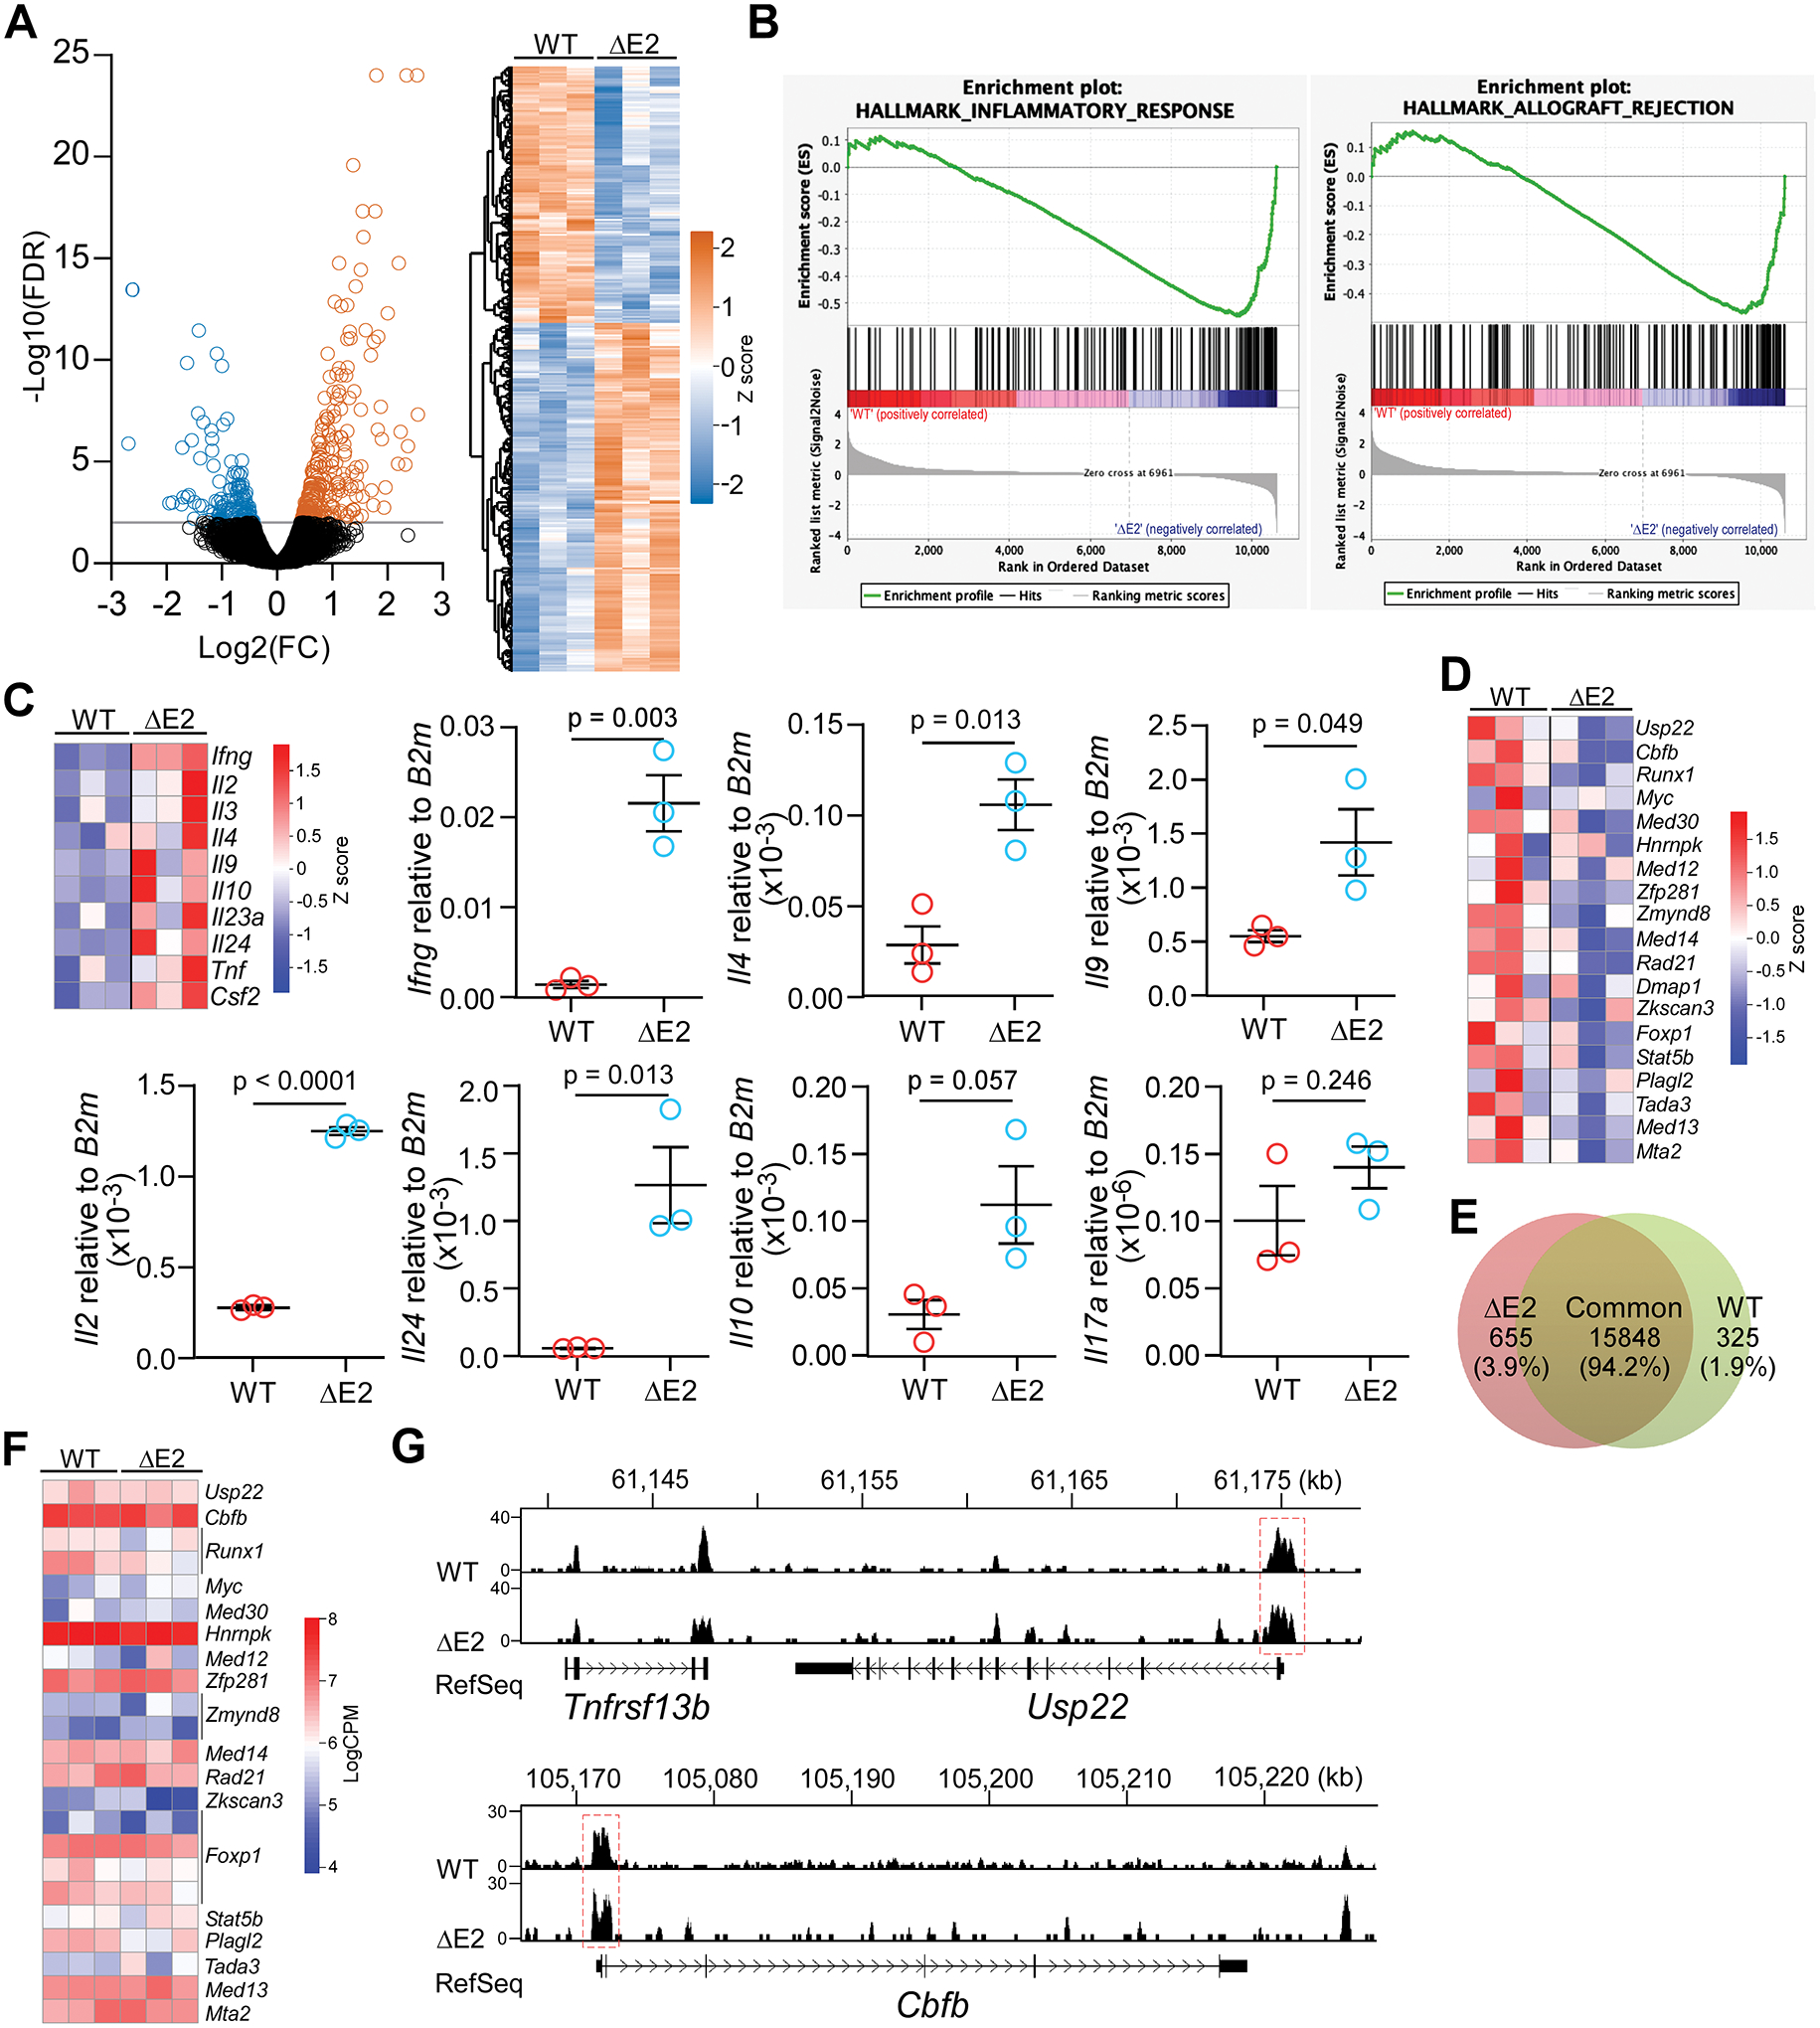
Figure 8. FOXP3 isoforms regulate target gene expression mostly independent of DNA binding.

(A) Volcano plot and hierarchical clustering heatmap showing differential gene expression in FOXP3 ΔE2 Tregs. (B) Up-regulated genes in FOXP3 ΔE2 Tregs are enriched in inflammatory response and allograft rejection gene sets. (C) Heatmap (RNA-seq) and RT-qPCR showing up-regulation of cytokines in FOXP3 ΔE2 Tregs. (D) Heatmap of Foxp3 positive regulators in FOXP3 ΔE2 and FOXP3 FLTregs. (E) FOXP3 binding peaks enriched in FOXP3 ΔE2 vs WT (FOXP3 FL) Tregs (change ≥ 1.5 folds, p < 0.05). (F) Heatmap of FOXP3 ΔE2 and FOXP3 FL binding (LogCPM) to the loci of Foxp3 positive regulators in (D). (G) Representative plots of FOXP3 ChIP-seq reads from FOXP3 ΔE2 and FOXP3 FL (WT) Tregs at the Usp22 and Cbfb gene loci. n = 3 mice/group for both RNA-seq and ChIP-seq analysis. Data in (C) represent mean ± SEM (n = 3 mice) with p by two tailed t-test.
