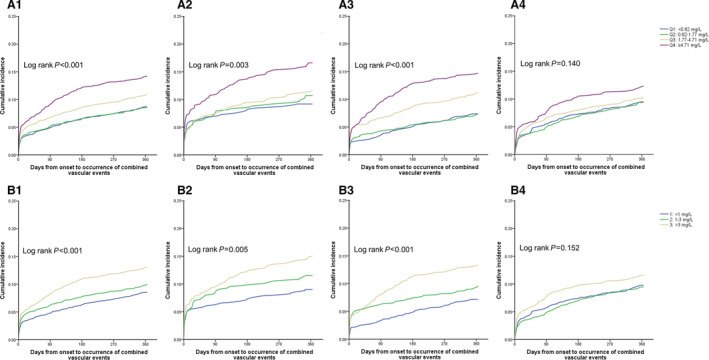
Figure 3. Cumulative incidence of 1‐year combined vascular events, according to hsCRP levels.

A, Patients were categorized into 4 groups according to hsCRP (high‐sensitivity C‐reactive protein) quartiles. B, Patients were performed by relative risk category (low risk, <1.0 mg/L; average risk, 1–3 mg/L; and high risk, >3 mg/L). A1, A2, A3, and A4, respectively, indicated total population, patients with onset‐to‐sample collection time within 24 hours, 24–72 hours, and 72 hours–8 days. Similarly, B1, B2, B3, B4 indicated total population, patients with onset‐to‐sample collection time within 24 hours, 24–72 hours, and 72 hours–8 days, respectively. Q1 indicates quartile 1; Q2, quartile 2; Q3, quartile 3; and Q4, quartile 4.
