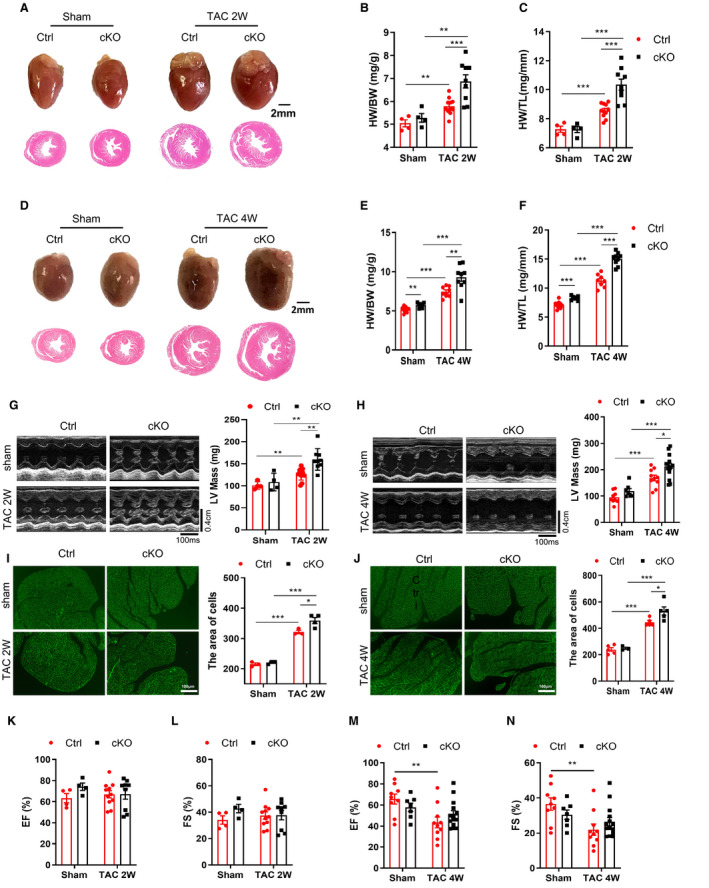
Figure 1. Deficiency of Bmal1 in cardiomyocytes promotes TAC‐induced myocardial hypertrophy.

A, Representative photographs (top) and H&E‐stained sections (bottom) of hearts after 2 weeks TAC surgery. Scale bar: 2 mm. B and C, The ratios of heart weight (HW) to body weight (BW) and to tibia length (TL) after 2 weeks TAC surgery. n=4 to 11 mice per group. D, Representative photographs (top) and H&E‐stained sections (bottom) of hearts after 4 weeks TAC surgery. Scale bar: 2 mm. E and F, The ratios of HW/BW and HW/TL after 4 weeks TAC surgery. n=7 to 9 mice per group. G and H, Representative echocardiographic images and assessment of left ventricle mass (LV Mass) in mice subjected to 2 weeks (G) and 4 weeks (H) TAC surgery. Transverse scale bar: 100 milliseconds. Vertical scale bar: 0.4 cm. n=4 to 14 mice per group. I and J, WGA‐staining and quantification of myocyte cross‐sectional area in mice subjected to 2 weeks (I) and 4 weeks (J) TAC surgery. Scale bar: 100 μm. n=3 to 5 mice per group. K and L, Echocardiographic assessment of ejection fraction (EF%) (K) and fractional shortening (FS%) (L) in mice following 2 weeks TAC surgery. n=4 to 11 mice per group. M and N, Echocardiographic assessment of ejection fraction (EF%) (M) and fractional shortening (FS%) (N) in mice following 4 weeks TAC surgery. n=7 to 14 mice per group. cKO indicates cardiomyocyte‐specific Bmal1 knockout mice; Ctrl, control mice; and TAC 2/4W, transverse aortic constriction 2/4 weeks. Data were presented as mean±SEM, *P<0.05, **P<0.01, ***P<0.00.
