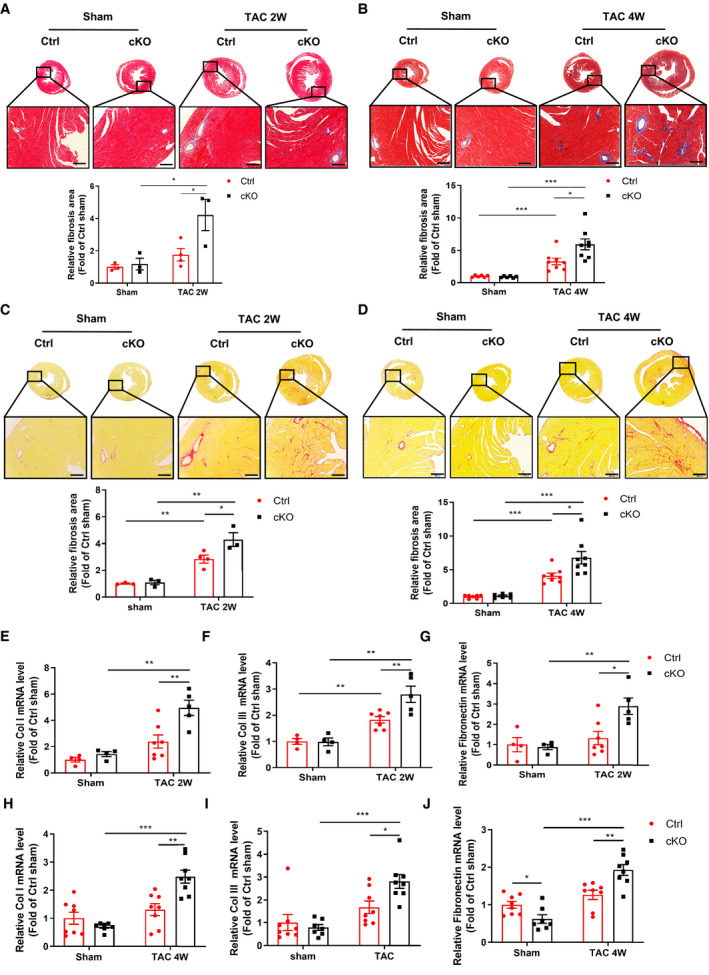
Figure 2. Deficiency of Bmal1 in cardiomyocytes accelerates TAC‐induced cardiac fibrosis.

A and B, Representative images of Masson’s trichrome staining and corresponding quantitative analysis of fibrotic (blue) areas in hearts after 2 weeks (A) and 4 weeks (B) of TAC surgery. Relative fibrosis area was analyzed by image J software. Scale bar: 200 μm. n=3 to 8 mice per group. C and D, Representative images of Sirius red staining and corresponding quantitative analysis of fibrotic (red) areas in hearts after 2 weeks (C) and 4 weeks (D) of TAC surgery. Relative fibrosis area was analyzed by image J software. Scale bar: 200 μm. n=3 to 8 mice per group. E through J, qRT‐PCR analysis of the mRNA levels of Col1α1, Col3α1, and fibronectin in the hearts of Ctrl and cKO mice in response to 2 weeks (E through G) and 4 weeks (H through J) TAC surgery. n=4 to 8 mice per group. cKO indicates cardiomyocyte‐specific Bmal1 knockout mice; Ctrl, control mice; and TAC 2/4W, transverse aortic constriction 2/4 weeks. Data were presented as mean±SEM, *P<0.05, **P<0.01, ***P<0.001.
