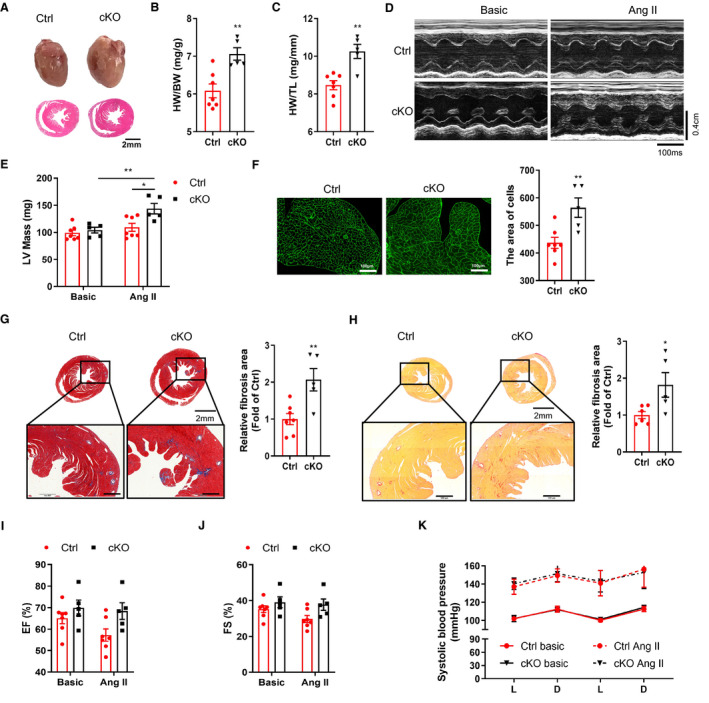
Figure 3. Deficiency of Bmal1 in cardiomyocytes promotes AngⅡ‐induced cardiac remodeling.

A, Representative photographs (top) and H&E‐stained section (bottom) of hearts after 4 weeks AngⅡ treatment. Scale bar: 2 mm. B and C, The ratios of HW/BW (B) and HW/TL (C) in Ctrl and cKO mice after 4 weeks AngⅡ treatment. n=5 to 7 mice per group. D and E, Representative echocardiographic images (D) and assessment of left ventricle mass (LV Mass) (E) in Ctrl and cKO mice after 4 weeks AngⅡ treatment. Transverse scale bar: 100 milliseconds. Vertical scale bar: 0.4 cm. n=5 to 7 mice per group. F, WGA‐staining and quantification of myocyte cross‐sectional area in Ctrl and cKO mice after 4 weeks AngⅡ treatment. Scale bar: 100 μm. n=5 to 7 mice per group. G, Representative images of Masson’s trichrome staining and the corresponding quantitative analysis of fibrotic (blue) areas in hearts after AngⅡ infusion. Relative fibrosis area was analyzed by image J software. Scale bar: 500 μm. n=5 to 7 mice per group. H, Representative images of Sirius red staining and the corresponding quantitative analysis of fibrotic (red) areas in hearts after AngⅡ infusion. Relative fibrosis area was analyzed by image J software. Scale bar: 500 μm. n=5 to 6 mice per group. I and J, Echocardiographic assessment of ejection fraction (EF%) (I) and fractional shortening (FS%) (J) in mice before and after AngⅡ treatment. n=5 to 7 mice per group. K, Diurnal rhythms of blood pressures in Ctrl and cKO mice before and after AngⅡ treatment. n=5 to 7 mice per group. AngⅡ indicates angiotensin Ⅱ; cKO, .cardiomyocyte‐specific Bmal1 knockout mice; Ctrl, control mice; HW/BW, heart weight/body weight; and HW/TL, heart weight/tibial length. Data were presented as mean±SEM, *P<0.05, **P<0.01.
