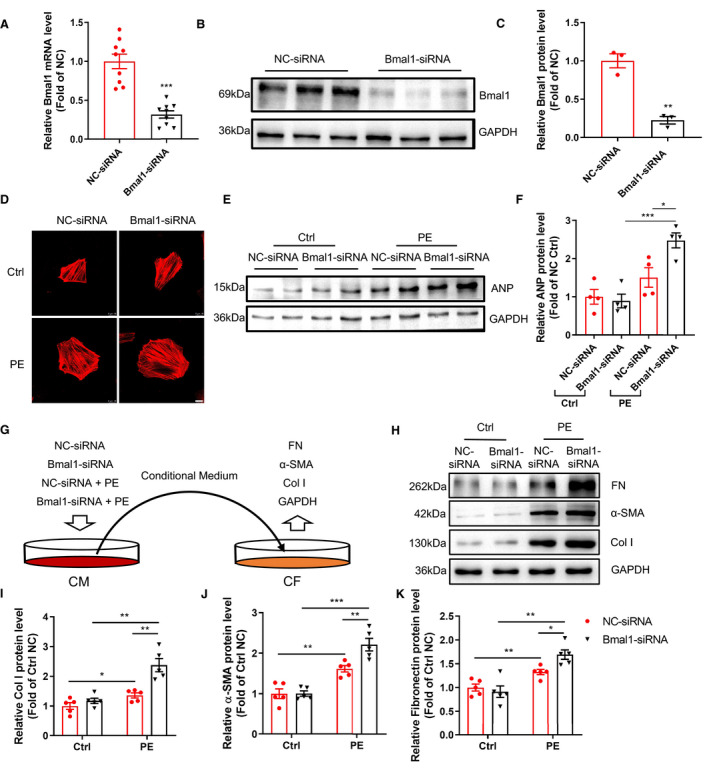
Figure 4. Silencing Bmal1 in cardiomyocytes promotes cardiomyocyte hypertrophy and triggers fibroblast‐to‐myofibroblast differentiation in vitro.

A through C, H9c2 cells were transfected with negative control (NC) or Bmal1 siRNA for 24 hour. Bmal1 expression was determined by qRT‐PCR (A) and western blot (B), the quantification was performed by image J (C). n=9 per group for mRNA, n=3 per group for western blot. D through F, H9c2 cells transfected with NC or Bmal1 siRNA were further treated with PE (200 µmol/L for 6 hour). Cells were stained with Phalloidin (red) to reflect cell size. Scale bar: 10 μm. Hypertrophic marker protein ANP was determined by western blot (E) and the quantification was performed by image J (F). n=4 per group. G, A schematic showing of an in‐direct co‐culture model: NRVMs were transfected with NC or Bma1 siRNA for 24 hour and treated with PE for another 6 hour. After PE stimulation, the supernatant was collected as conditional medium and added to NRCFs and further incubated for 24 hour. H through K, Western blot analysis and quantification of Col1α1, α‐SMA, and FN protein levels in NRCFs. n=5 per group. α‐SMA indicates alpha‐smooth muscle actin. CM indicates cardiac myocytes; CF, cardiac fibroblast; Col I, collagen 1a1; Ctrl, control group; and FN, fibronectin; PE, phenylephrinr group. Data were presented as mean±SEM, *P<0.05, **P<0.01, ***P<0.001.
