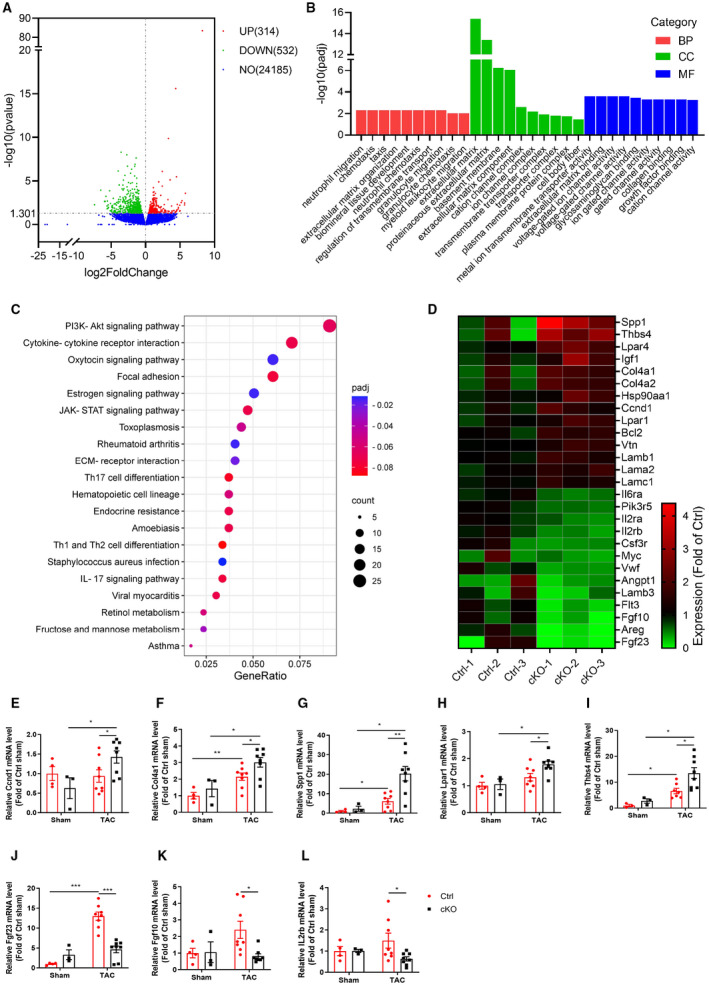
Figure 5. RNA‐sequence analysis of heart tissues from Ctrl and cKO mice after TAC surgery for 4 weeks.

A, Volcano plot of the differentially expressed genes (DEGs). The red dots represent genes upregulated in cKO mice, the green dots represent genes downregulated in cKO mice, and the blue dots represent non‐differentially expressed genes. B, Gene ontology (GO) analysis of the DEGs indicated that, compared with the Ctrl mice, the different gene profile predominantly clustered into extracellular matrix in the cKO mice. C, KEGG pathway enrichment analysis revealed that pathways associated with PI3K/AKT signaling pathway were the most enriched by DEGs. D, Heatmap of the DEGs related to PI3K/AKT signaling pathway. The map is color coded with red corresponding to upregulation and blue to downregulation. E through L, Independent qRT‐PCR validation of Ccnd1 (E), Col4α2 (F), Spp1 (G), Lpar1 (H), Thbs4 (I) and Fgf23 (J), Fgf10 (K), IL2rb (L) expression in heart tissues from Ctrl and cKO mice. n=3 to 8 mice per group. BP, biological process; CC, cell component; cKO, cardiomyocyte‐specific Bmal1 knockout mice; Ctrl, control mice; MF, molecular function; NO, no difference; and TAC, transverse aortic constriction. Data were presented as mean±SEM, *P<0.05, **P<0.01, ***P<0.001.
