
Figure 2.
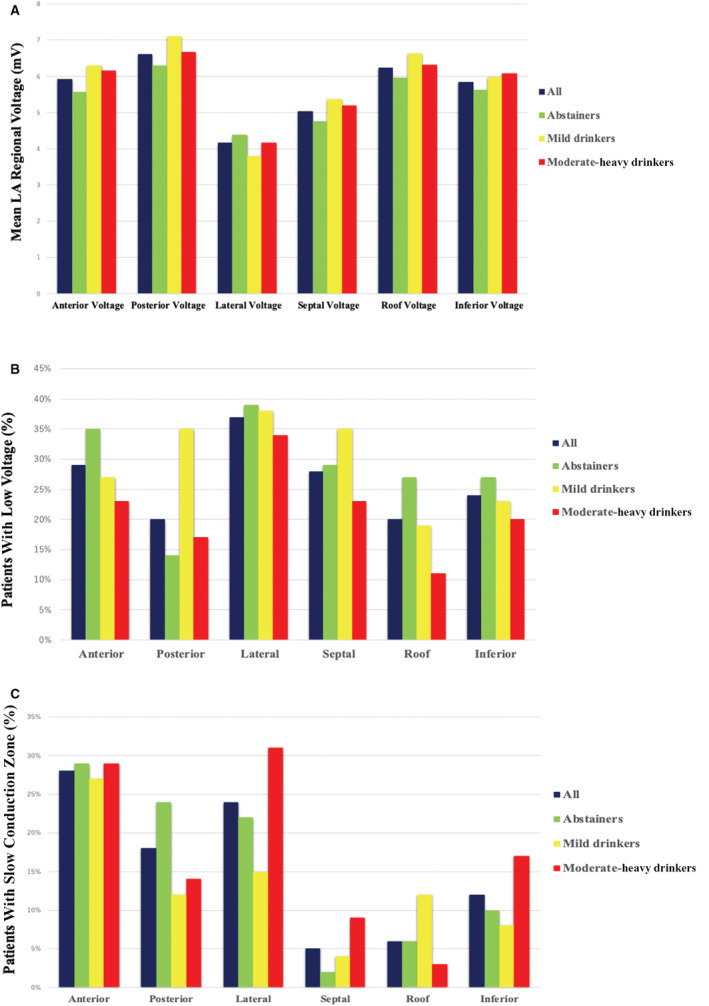
Mean LA regional voltage and distribution of low voltage and SCZ in different LA segments.
A, Mean LA regional voltage in abstainers, mild drinkers, and moderate‐heavy drinkers. No significant difference in mean LA regional voltage in each segment was observed among the 3 groups. The differences in mean LA regional voltage were analyzed using 1‐way ANOVA, or the Kruskal‐Wallis test, as appropriate. B, Distribution of low voltage in different LA segments in abstainers, mild drinkers, and moderate‐heavy drinkers. No significant difference in the prevalence of low voltage in each segment was observed among the 3 groups. C, Distribution of SCZ in different LA segments in abstainers, mild drinkers, and moderate‐heavy drinkers. No significant difference in the prevalence of SCZ in each segment was observed among the 3 groups. The differences in the prevalence of low voltage or SCZ were analyzed using χ2 test. LA indicates left atrium; and SCZ, slow‐conduction zone.