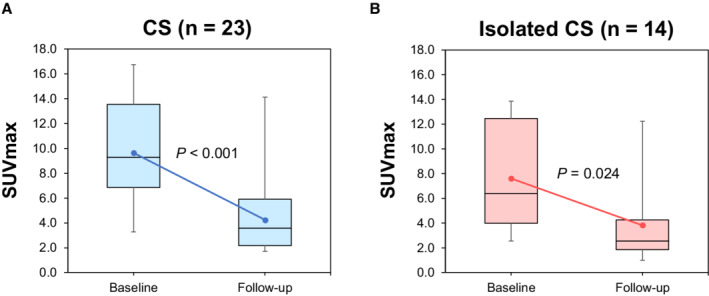
Figure 4. Changes in SUVmax during steroid therapy in patients with subsequent FDG‐PET evaluation.

Box plots with median and interquartile range of the observed data obtained at baseline and subsequent evaluation after steroid therapy. Error bars represent 95% CIs. The regression line was obtained using a mixed‐model approach. SUVmax significantly improved at subsequent follow‐up in CS (P<0.001; A) and isolated CS (P=0.024; B). CS indicates cardiac sarcoidosis, and SUVmax, maximum standardized uptake value.
