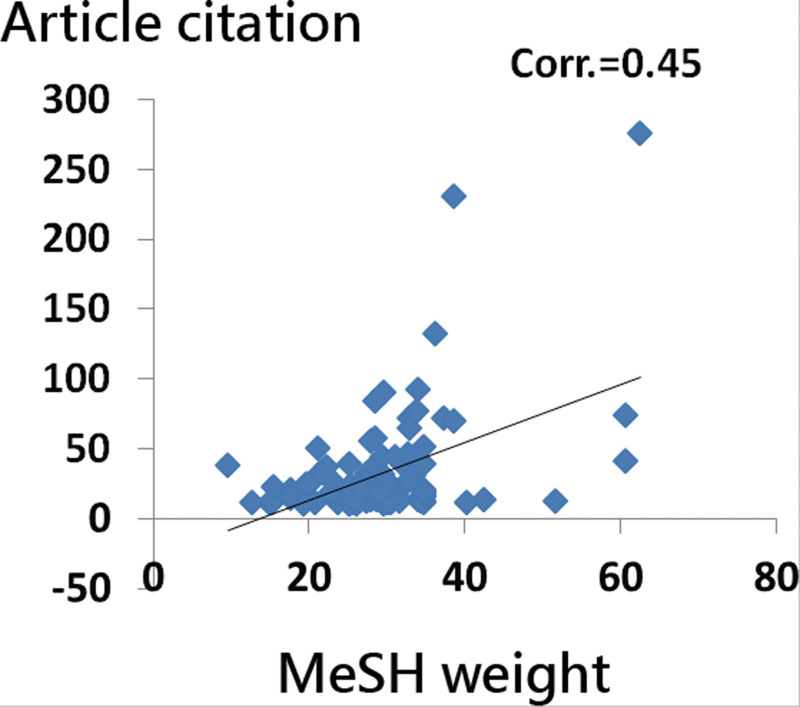
Figure 6.
Using MeSH terms to predict article citations. Note. The 100 top-cited articles are demonstrated in the linear regression, with the x-axis representing the weight of MeSH terms and the y-axis representing the article citation. The regression equation is defined as y = −0.01700 + 1.1155 × x. The correlation coefficient (CC) is 0.45, which was statistically significant (F=28.04, P<.001). It is very obvious that MeSH in the model is collinear with the number of article citations.

