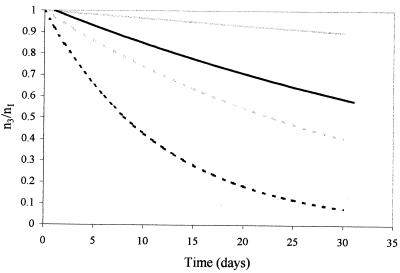
FIG. 3.
Estimates of population degradation dynamics for above-freezing conditions, based on temperature-dependent degradation coefficients (19) and temperature- and water potential-dependent degradation coefficients (reported for above-freezing temperatures [Table 1]). Estimates show differences between temperature-based estimates of the decay coefficient k at 4 (solid gray line) and 20°C (dotted gray line) and temperature and water potential estimates at 4 (solid black line) and 20°C (dotted black line) over the course of 30 days with water potential stresses of −0.5 bars. Graph depicts proportion of potentially infective oocysts remaining relative to the number added for each trial (n3/n1) versus duration of exposure (days).

