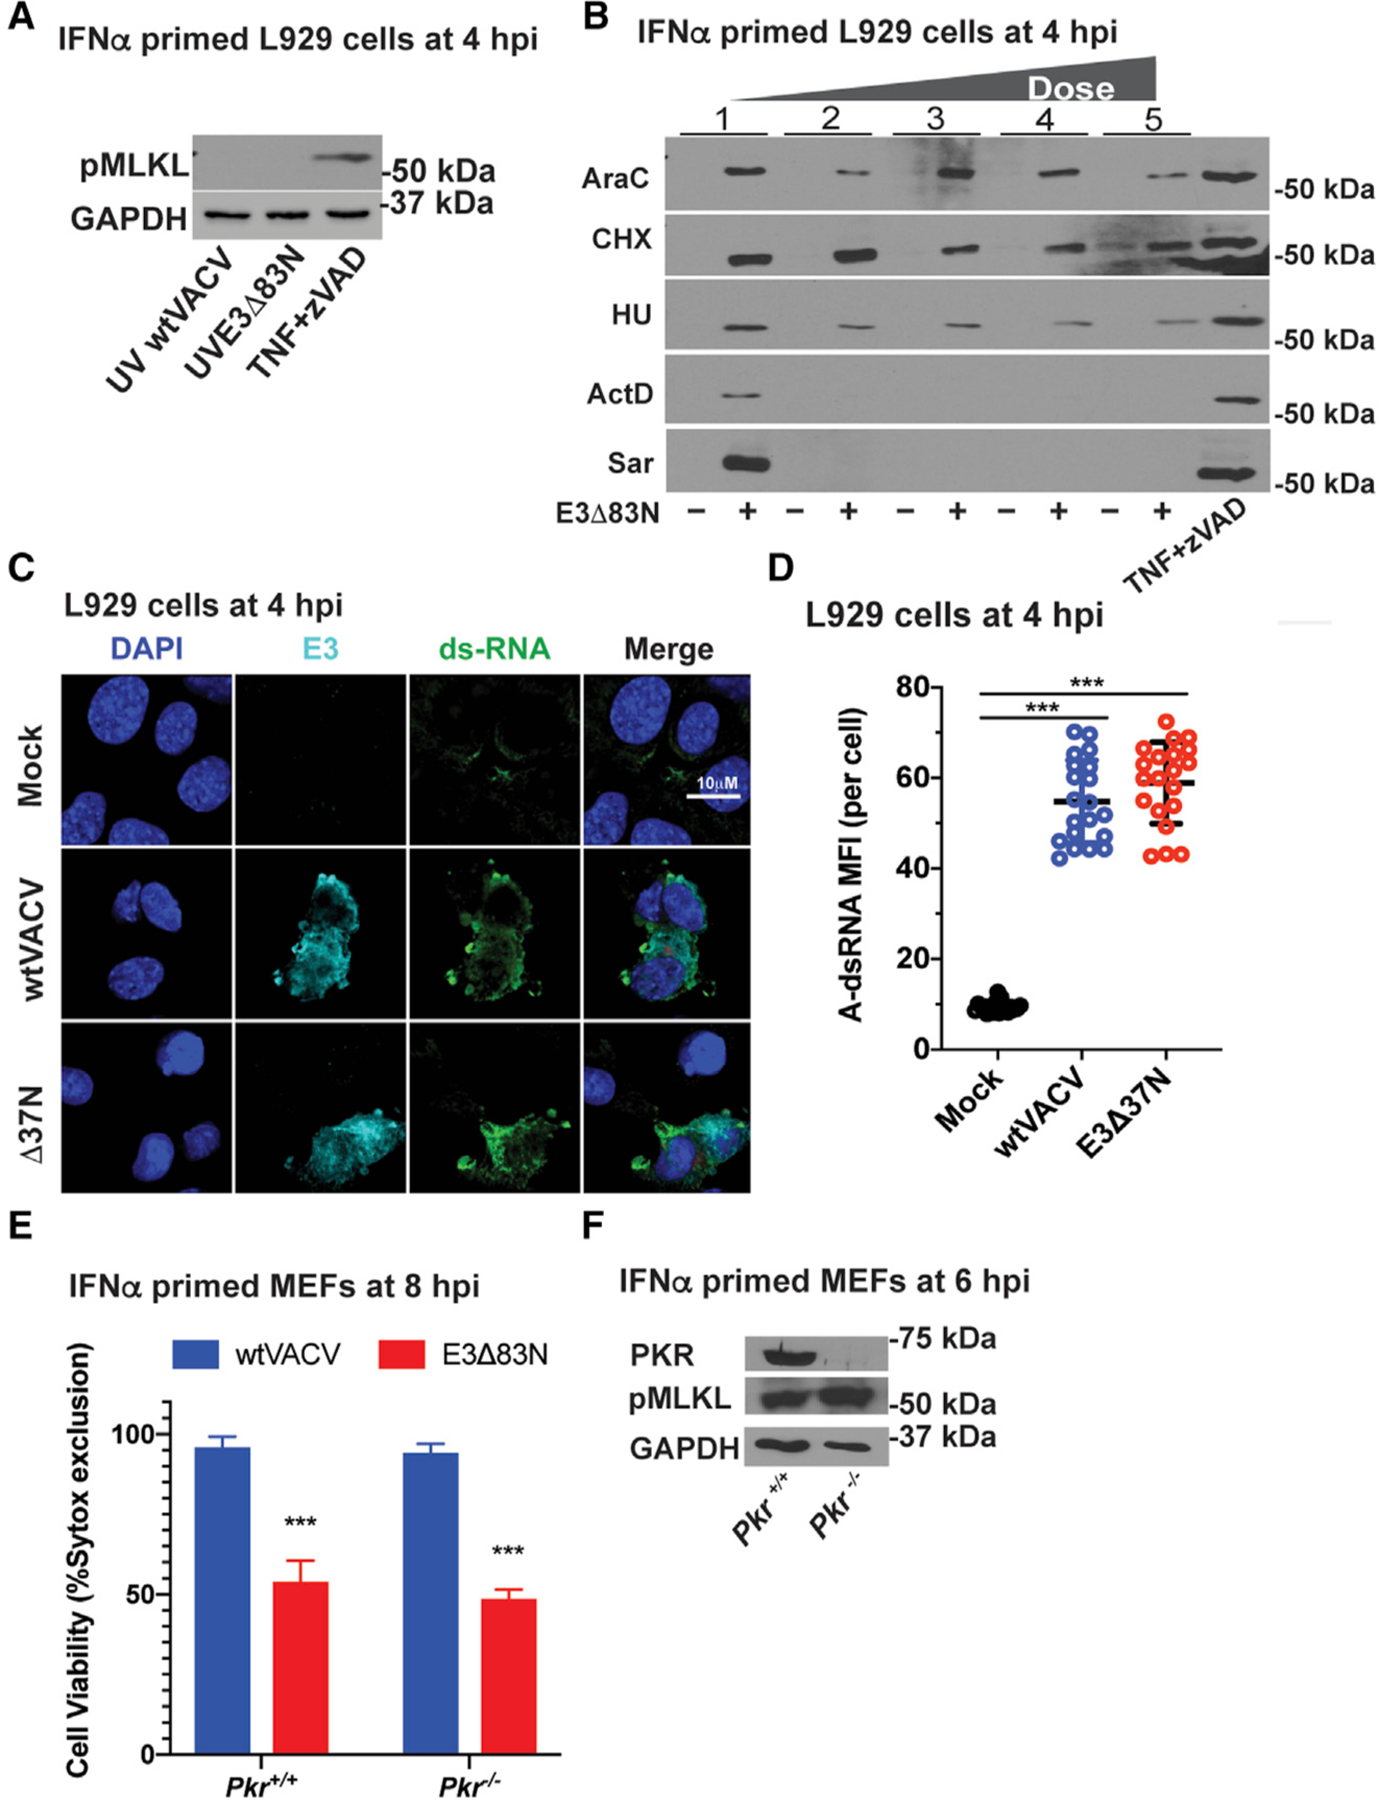
Figure 4. VACV E3 Zα regulates transcription-dependent induction of necroptosis without any contribution of PKR.

(A) IB of L929 cells that were IFN-α-pretreated as described in Figure 1 and then infected with an equivalent MOI of 5 using UV-inactivated viral particles. TNF plus zVAD-fmk is shown as a positive control as described in Figure 1. Lysates were harvested at 4 hpi and, following SDS-PAGE, evaluated for phospho-MLKL.
(B) IB of L929 cells that were IFN-α-pretreated as described in Figure 1 and then treated with increasing doses of the following inhibitors: cytosine arabinoside (AraC), at 200, 400, 800, and 1,600 mg/mL; cycloheximide (CHX) at 20, 40, 80, and120 mg/mL; hydroxyurea (HU) at 5, 10, 20, and 40 mM: actinomycin D (ActD) at 1, 2, 4, and 8 mg/mL; and, Sarracenia extract (Sar) at 10, 30, 60, and 120 µL/mL. Treatment with AraC, HU, ActD, and Sar started 1 h prior to infection and continued throughout infection. Treatment with CHX started 30-min post-adsorption and continued throughout infection. Positive control TNF plus zVAD-fmk is described in Figure 1. Lysates were harvested at 4 hpi and, following SDS-PAGE, evaluated for phospho-MLKL.
(C) Confocal immunofluorescent micrographs of L929 cells either uninfected (mock) or virus-infected at a MOI of 5 with WT VACV or E3Δ37N, fixed and permeabilized then subsequently stained with J2 anti-A-RNA (green), anti-E3 (cyan), and DAPI nuclear dye (blue). Bar represents 10 μM.
(D) Quantification of the median fluorescence intensity of A-form dsRNA-specific staining by J2 antibody analyzed with Leica LAS X software to generate mean fluorescence intensity of 20 individual cells with mean indicated.
(E) Viability of IFN-primed Pkr+/+ and Pkr−/− MEFs infected at a MOI of 5 with WT VACV or E3Δ83N. Cell viability was determined at 8 hpi by Sytox dye exclusion as described in Figure 1.
(F) IB of Pkr+/+ and Pkr −/− MEFs primed with IFN for 18 h and then infected with E3Δ83N as in (E). Lysates were harvested at 6 hpi and, following SDS-PAGE, evaluated for PKR, phospho-MLKL, or GAPDH.
Error bars represent SD. Statistical significance was determined as described in Figure 1. Each set of data is representative of two replicates except for (F), which compiles the results of the replicates. Statistical significance was determined as described in Figure 1.
