Figure 10.
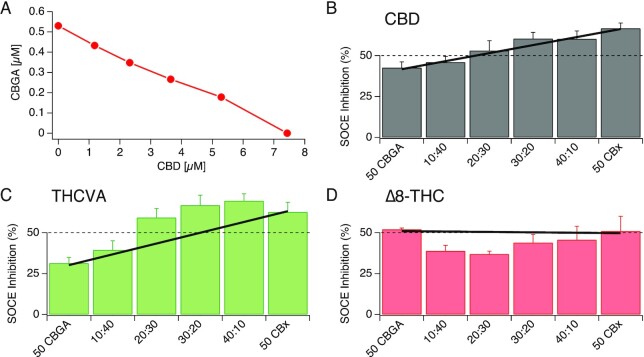
Isobolographic analysis of CBGA and other cannabinoids against SOCE. (A) An isobole showing dose pairs of CBGA and CBD that are expected to inhibit SOCE by 50%. The y- and the x-intercepts represent the IC50 values of CBGA and CBD, respectively. (B) Inhibition of SOCE observed when Jurkat NFAT cells were treated with concentration pairs of CBGA and CBD. The dashed line depicts the expected 50% inhibition of SOCE at each dose pair. The bold line connects the actual inhibition observed when treated separately with CBGA and the other cannabinoid (CBD) at individual IC50. The bars represent the observed inhibition when treated with various concentration pairs of the two compounds. Here, the bars fall on the bold line, indicating that the two compounds follow a simple additivity behavior. (C) Dose pairs of CBGA and THCVA show deviation from expected inhibition. The green bars above the bold line suggest supra-additive (synergistic) effects between the two compounds. (D) Concentration pairs of CBGA and Δ8-THC show deviation in the opposite direction, suggesting subadditive (inhibitory) effects.

