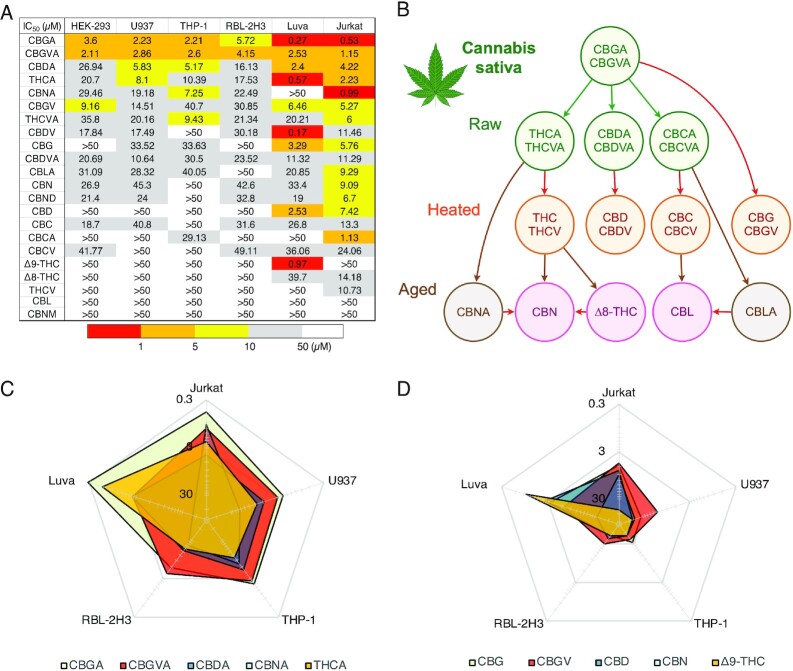
Figure 11.
Differential potency of cannabinoids in modulating SOCE across various immune cells. (A) Heat map demonstrating IC50 values of cannabinoids against SOCE across 5 immune cell lines and 1 nonimmunological cell line. Red colored boxes indicate higher potency and white boxes indicate lower potency of SOCE inhibition (see table legend). (B) Biosynthetic pathway of cannabinoids in the Cannabis plant. Arrows indicate the direction of metabolism from precursor cannabinoids. (C) IC50 values of the top 5 most potent cannabinoids represented in a radar chart. The chart demonstrates that certain cannabinoids elicit similar IC50 values between specific types of immune cells while other display a differential potency. (D) IC50 values of the nonacidic version of the top 5 most potent cannabinoids represented in a radar chart format to highlight the difference in potency between these compounds and their acidic counterparts in C as well as across the 5 immune cell lines.

