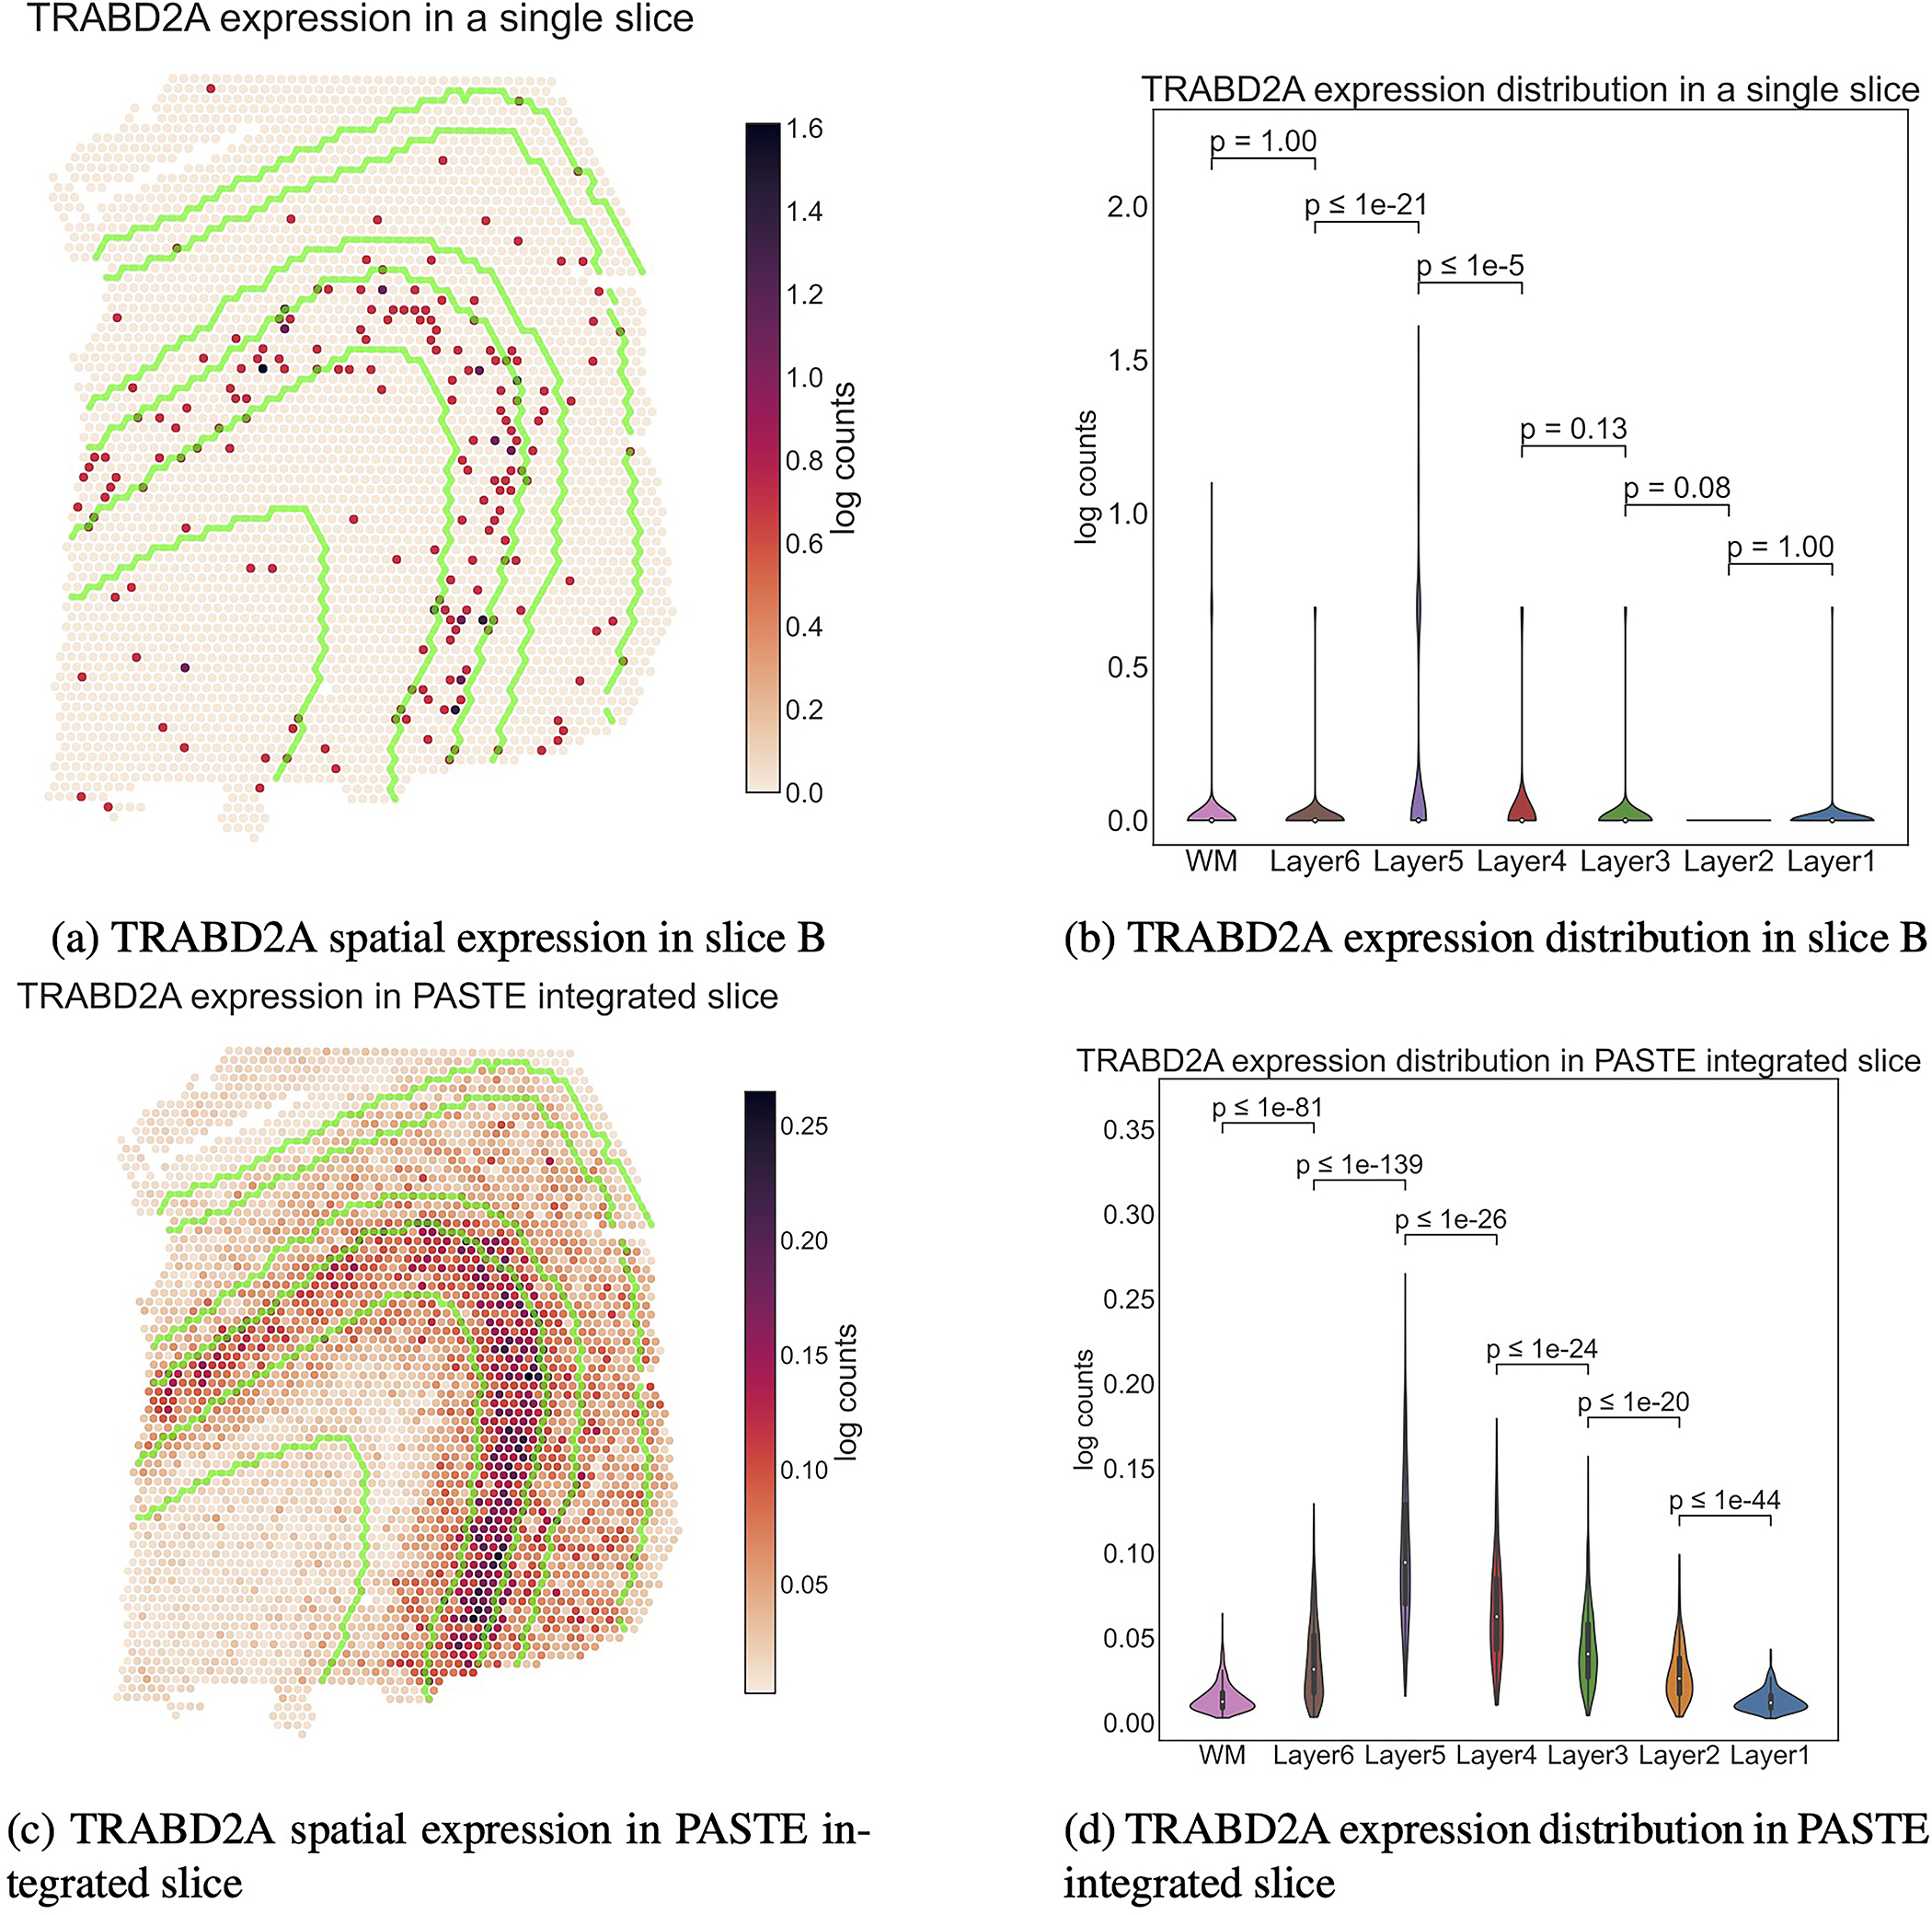
Extended Data Fig. 8. TRABD2A expression in a single slice and PASTE integrated slice.

The boundaries between the layers are marked in green in a and c. WM and Layers 6 to 1 have 625, 614, 621, 247, 924, 224 and 380 spots respectively. Inner boxplots show the 25\%, 50\% and 75\% quantiles of the distributions. $p$-values (rounded to the closest power of $10$) for the difference in distribution (two-sided Mann-Whitney U test) between adjacent layers are indicated. TRABD2A was validated using smFISH in [31] as a layer 5 marker gene.
