
Figure 4: PASTE Center Slice Integration of SCC tumor [21] into a center slice.
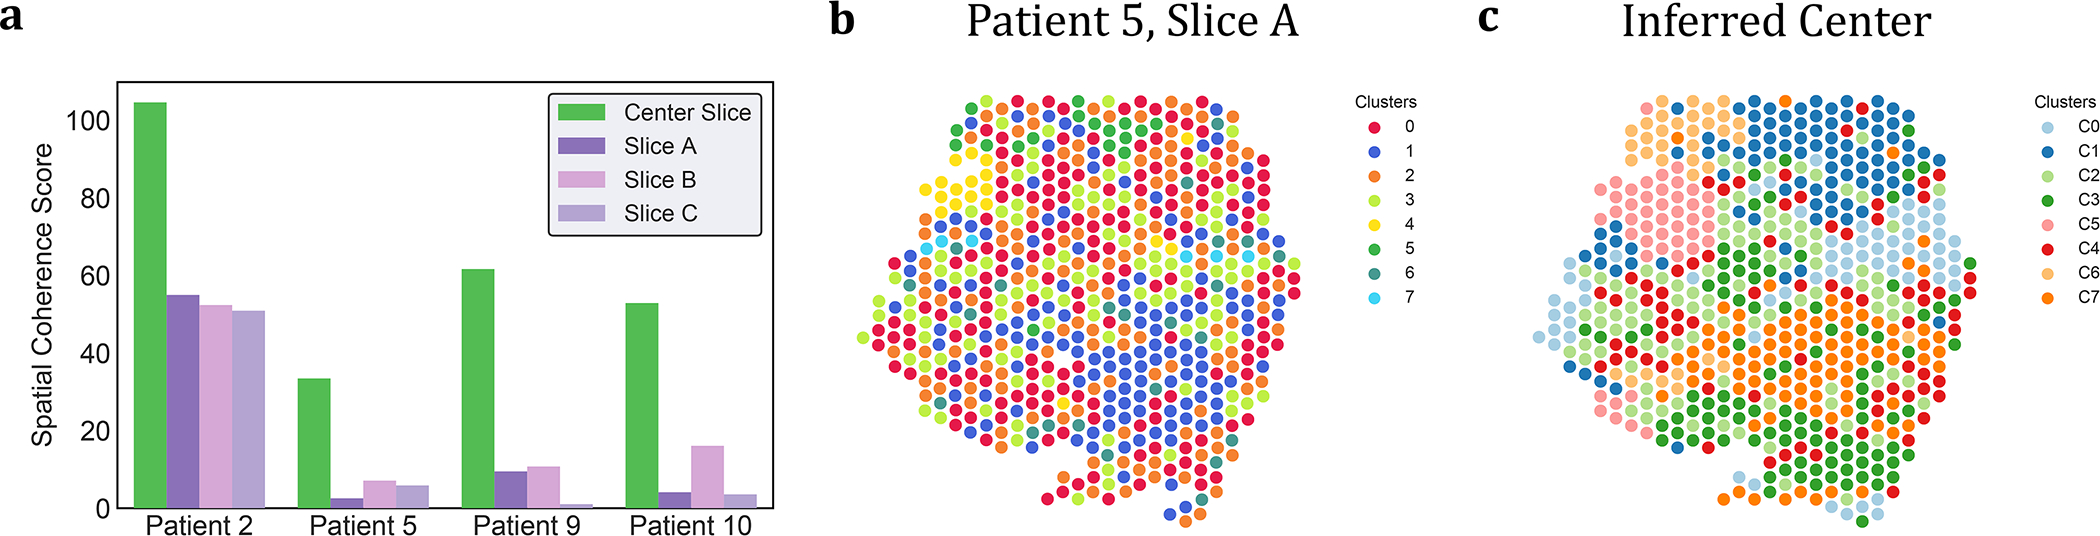
(a) Spatial coherence scores for the clusters obtained from the center slice inferred by PASTE (green) and for the published clusters from [21] on the individual slices from each patient (purple and pink). (b) Published cluster labels of spots in slice A of patient 5. (c) Cluster labels C1, . . . , C7 of spots obtained from PASTE’s inferred center slice for patient 5.