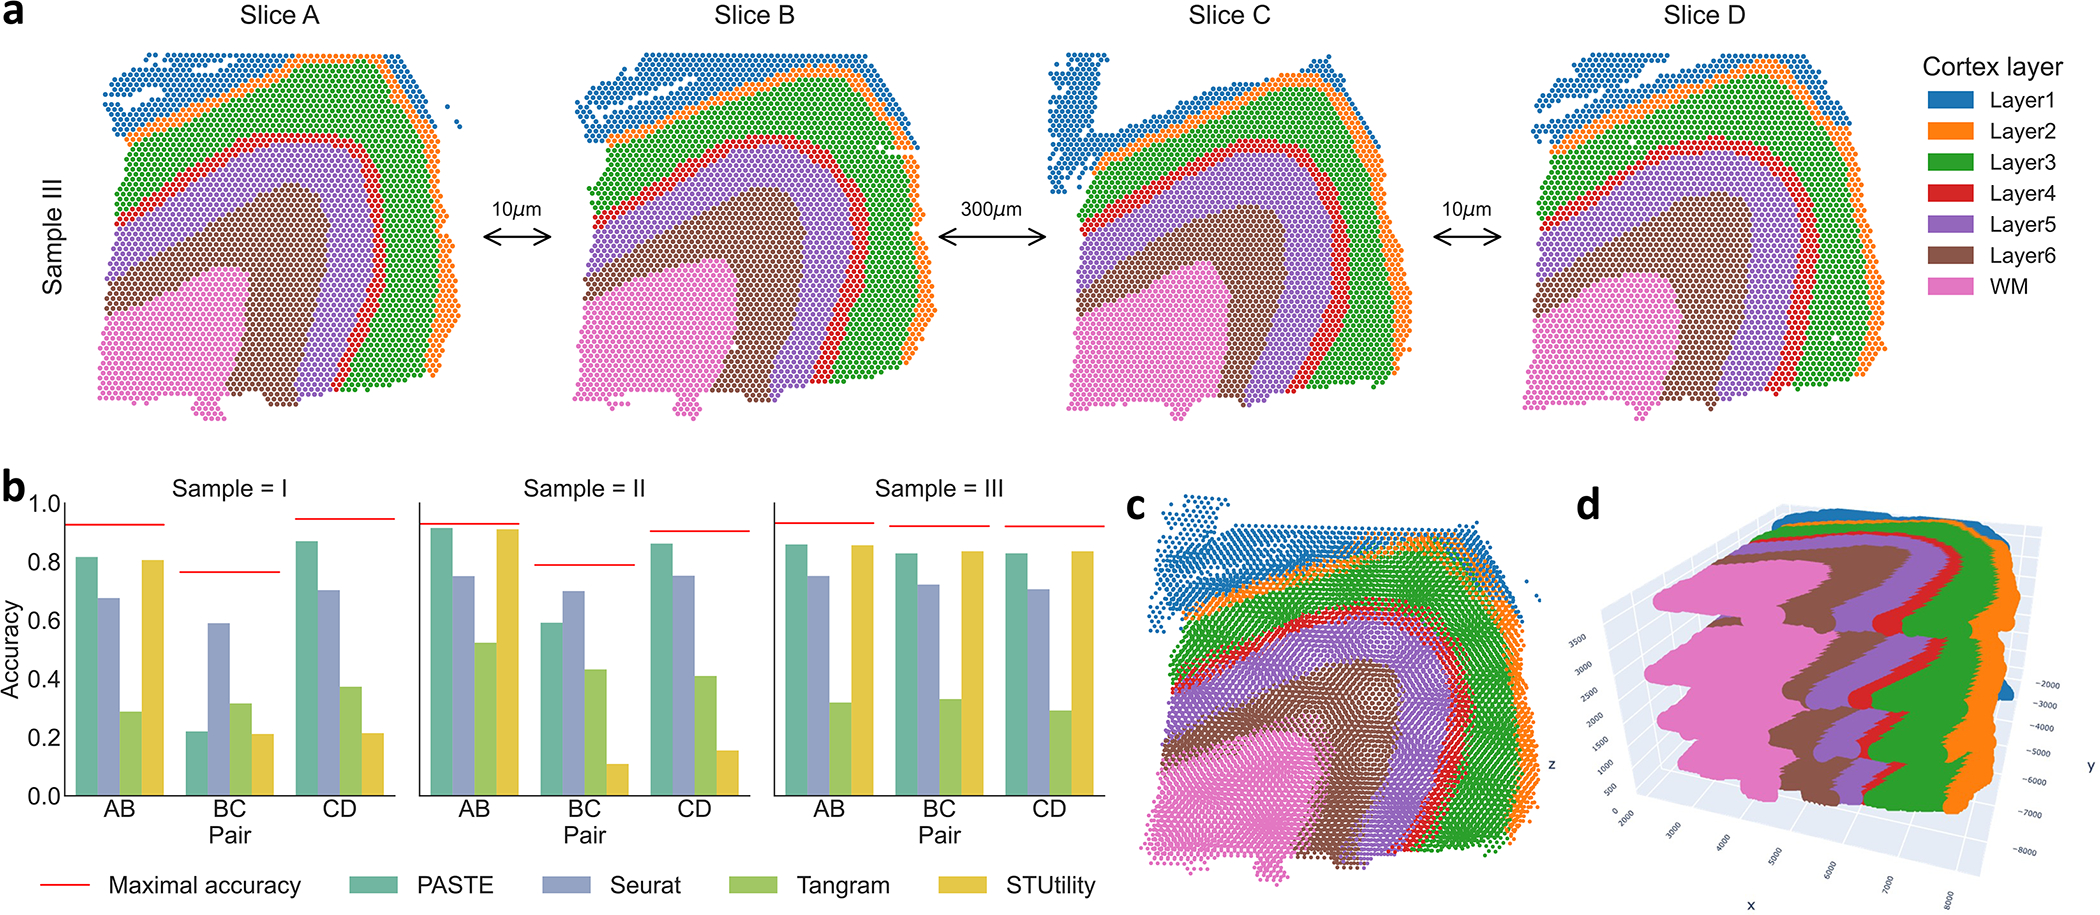
Figure 5: PASTE pairwise alignment and stacked 3D alignment of DLPFC sample III.

(a) One sample of DLPFC with four slices labeled A,B,C and D, with spots colored according to the manual annotations from [31]. The first pair (AB) and last pair (CD) of slices are adjacent (10μm) while the middle pair (BC) are further apart (300μm). Spots in each slice are colored according to the the annotation from [31] that classifies spots into six neocortical layers and white matter. (b) Accuracy of pairwise alignment of consecutive DLPFC slices (labeled AB, BC, and CD) for PASTE, Seurat, Tangram and STUtility. Accuracy is computed from the published annotation of each spot. Red line marks the maximal possible accuracy given the number of spots in each layer in the two slices. (c) Stacking four ST slices of DLPFC sample III using coordinates from PASTE pairwise alignments. (d) Stacked 3D alignment of the four tissue slices of DLPFC sample III after alignment with PASTE. The z-axis is not to scale.
