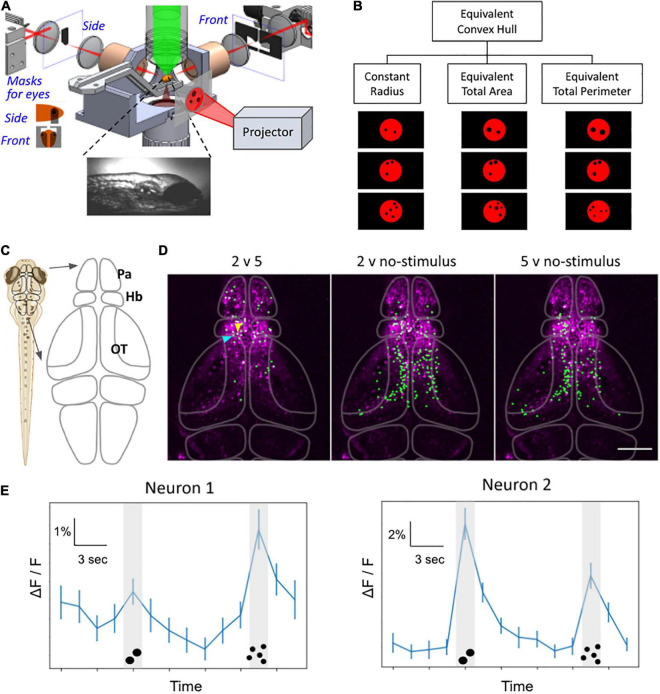
FIGURE 4.
Whole-brain functional imaging to find neural substrate of zebrafish numerosity capability. (A) Schematic setup of the 2p-SPIM setup that allows calcium imaging of awake zebrafish larvae that are subjected to visual numerosity stimuli. (B) Examples of the numerosity stimuli, which consist of a particular number of black dots on a diffuse red background. The visual patterns are controlled for various non-numerosity continuous variables to find the responses that are intrinsic to the recognition of discrete numbers. (C) Schematic drawing of the brain. The forebrain includes the pallium (Pa) and the habenula (Hb). The midbrain contains the optic tectum (OT). (D) Representative results from 8-dpf larvae show neurons that exhibited different levels of activity during different stimuli (e.g., 2 versus 5 dots, etc.). Green: nuclei of identified neurons. Magenta: anatomical background generated via the maximum-intensity projection in Z of the standard deviation projection in time, depicting neurons with time-varying activity. The raw dataset covers the volume of ∼350 μm × 600 μm × 250 μm (depth), taken with three sections per volume for 42 min. (E) Representative activity traces, of the two neurons selected by arrowheads in panel (D), during number stimuli. The line graph depicts activity levels as ΔF/F for the time trial as shown, averaged over n = 50 trials. Neuron 1 (blue arrowhead): higher activity levels during the 5-dot stimuli compared to the 2-dot stimuli. Neuron 2 (yellow arrowhead): higher activity levels during the 2-dot stimuli compared to the 5-dot stimuli. P < 0.05, bootstrapping with resampling. Error bars represent SEM, n = 50. Scale bar in panel (D),100 μm.

