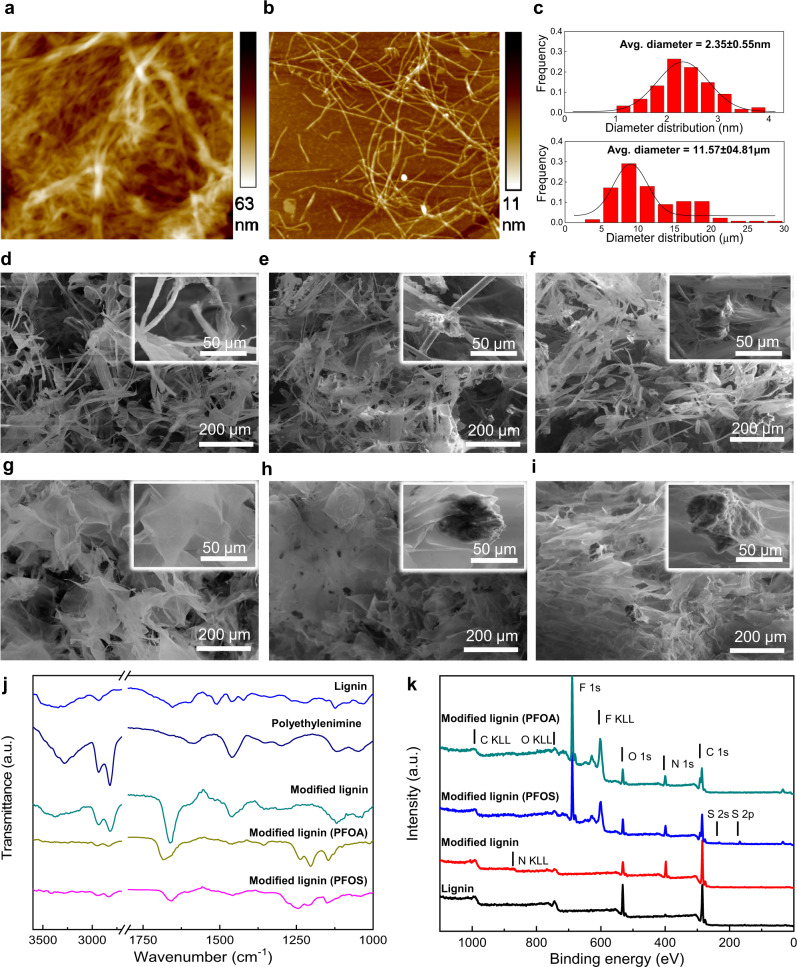
Fig. 2. The characterization of the bioinspired composite materials and their components.
a The AFM image of cellulose fibers. b The AFM image of cellulose nanofibrils. c, The average diameter estimates of cellulose fibers and cellulose nanofibrils. d The typical SEM image of cellulose fibers, e The typical SEM image of cellulose fiber/lignin composite. f The typical SEM image of cellulose fiber/modified lignin composite. g The typical SEM image of cellulose nanofibrils. h The typical SEM image of cellulose nanofibril/lignin composite. i The typical SEM image of RAPIMER composite. j The FTIR spectra of lignin, polyethylenimine, modified lignin, and modified lignin after PFAS adsorption. The top light blue line: lignin, the second top dark lune line: polyethylenimine, the third green line: modified lignin, the fourth yellow-green line: PFOA adsorbed modified lignin, the bottom purple line: PFOS adsorbed modified lignin. k The XPS spectra of different lignin, modified lignin, and modified lignin after PFAS adsorption. The top green line: PFOA adsorbed modified lignin. The second blue line: PFOS adsorbed modified lignin. The third red line: modified lignin. The bottom black line: lignin. For SEM images, the experiment was reproduced n = 3 times.The Source data is provided as a Source Data file.

